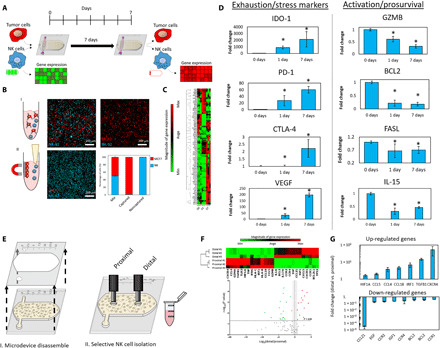
Fig. 2. Culture in the tumor-on-a-chip microdevice led to NK cell exhaustion.

(A) Schematic representation of an experiment measuring immune exhaustion. NK cells and MCF7 cells were mixed with the collagen mixture and cocultured in a 1:3 ratio (0.5 million cells/1 ml:1.5 million cells/1 ml) for 7 days. This approach guaranteed that NK cell density was homogeneous across the hydrogel (e.g., proximal versus central versus distal area). After 7 days, the NK cells were isolated, and gene expression and other characteristics were measured. (B) Scheme of NK cell separation. MCF7 cells attach to magnetic beads, thus isolating NK cells in suspension. Confocal images represent captured MCF7 cells (in red) and isolated NK cells (in blue). The graph highlights the efficiency of NK cell isolation. (C) Cluster graph depicting gene expression after 0, 1, and 7 days. (D) Bar graphs show the up-/down-regulation of exhaustion markers and activation/prosurvival genes. (E) Scheme of spatially controlled NK cell isolation from proximal and distal regions. (F) Cluster graph and volcano plot quantifying gene expression in the proximal and distal regions. (G) Bar graphs depicting the increase of up-regulated genes and decrease of down-regulated genes in the distal versus proximal regions. Asterisk denotes P value of <0.05; graphs show means ± SD.
