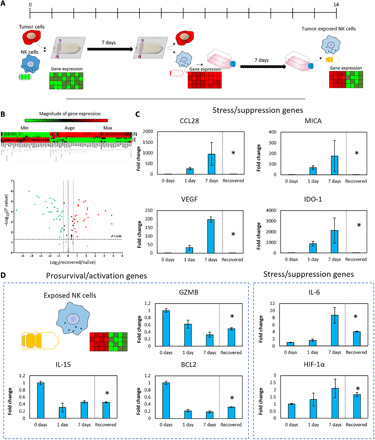
Fig. 5. NK cell recovery from the tumor-on-a-chip platform.

(A) Schematic representation of the experiments evaluating the recovery capacity of NK-92 cells. NK-92 and MCF7 cells were cocultured (0.5 million NK:1.5 million MCF7 cells/ml) for 7 days. Then, NK-92 cells were isolated from the tumor-on-a-chip and subcultured in traditional flasks for an additional week before analyzing their gene expression. (B) Clustergram and volcano plot comparing gene expression in exposed NK cells with naïve NK cells. (C) Bar graphs showing multiple genes that were up-/down-regulated in the tumor-on-a-chip microdevice but returned to the basal expression after 1 week. (D) Bar graphs showing genes that showed partial or no recovery to the basal expression compared with naïve NK cells. Asterisk denotes P value of <0.05; graphs show means ± SD.
