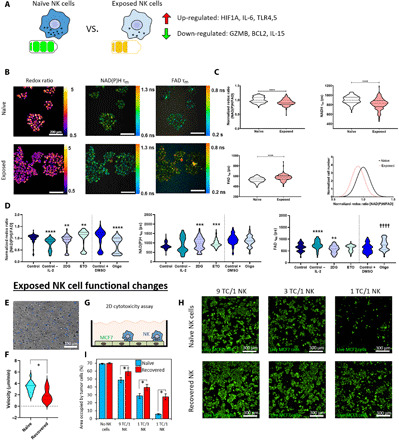
Fig. 6. Functional changes in exposed NK cells.

(A) Exposed NK cells isolated from the tumor-on-a-chip microdevice still exhibited multiple gene expression alterations after a week in traditional flasks. (B) Optical metabolic imaging was used to visualize intracellular NAD(P)H and FAD fluorescence intensities [redox ratio = NAD(P)H intensity divided by FAD intensity] and mean fluorescence lifetimes (τm). (C) Violin plots showing the analysis of NK cell redox ratio based on NAD(P)H and FAD intensity. Exposed NK cells had decreased redox ratio compared with naïve NK cells, indicating metabolic rewiring. In addition, exposed NK cells showed decreased NAD(P)H τm and increased FAD τm. (D) Violin plots depicted changes in redox ratio, NAD(P)H τm, and FAD τm caused by different metabolic inhibitors and chemokines: 2DG, glycolysis inhibitor; etomoxir (ETO), fatty acid oxidation inhibitor; oligomycin (Oligo), electron transport chain complex V inhibitor; DMSO, dimethyl sulfoxide. (E and F) Time-lapse microscopy analyzing exposed NK cell migration in 3D collagen hydrogels. Individual NK cell trajectories are depicted in different colors. Violin plot showing slower migration speed in exposed NK cells. (G and H) Cytotoxicity analysis of exposed and naïve NK cells. A monolayer of MCF7 was seeded in traditional well plates, and naïve or exposed NK cells were added on top. Confocal images showed the killing capacity of both exposed and naïve NK cells. (I) Bar graph analyzing the destruction of MCF7 cells shown in (H) for different ratios of tumor cells (TC) to NK cells (NK). Exposed NK cells exhibited decreased cytotoxic capacity compared with naïve NK cells. *P < 0.05, **P < 0.01, ***P < 0.005, ****P < 0.001; graphs show means ± SD.
