
Fig. 2. RLN gene delivery suppressed tumor growth and modified TME in KPC pancreatic tumor model.
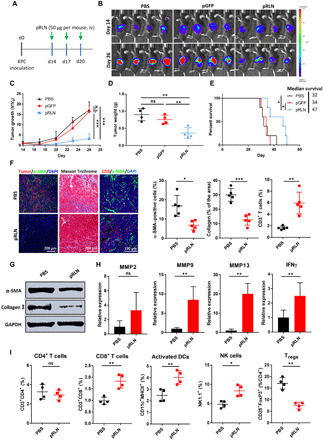
(A) The dosing schedule for the administration of pRLN. (B) Tumor growth monitored by IVIS imaging after different treatments and (C) the quantification of the imaging data (n = 4). (D) Tumor weight recorded on day 26 after the sacrifice of mice (n = 4). (E) Survival curves in each treatment group (n = 5). (F) Modification of the TME detected by IF staining and Masson Trichrome and the quantification of α-SMA, collagen expression, and CD3+ T cell infiltration (n = 5 samples per group). (G) Expression of α-SMA and collagen I detected with Western blot after the administration of PBS or pRLN (n = 3). (H) Relative expression of MMP2, MMP9, MMP13, and IFNγ detected by RT-PCR (n = 4). (I) Immune cell infiltration in the tumor tissue detected by flow cytometry (n = 4). Statistical significance was calculated in (C) using two-way analysis of variance (ANOVA) with multiple comparisons, in (D) using one-way ANOVA with multiple comparisons, in (E) using log rank test, and in (F), (H), and (I) using t test. *P < 0.05, **P < 0.01, and ***P < 0.001; ns, not significant; Tregs, regulatory T cells.