
Fig. 3. RLN gene delivery altered macrophage populations in the tumor.
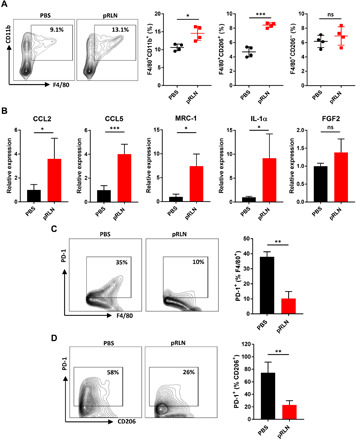
(A) Evaluation of the change of macrophage populations in the tumor after different treatments by detecting a macrophage pan-marker F4/80 and a traditional M2 marker CD206 with flow cytometry (n = 4). (B) Relative mRNA expression of cytokines in the tumor of mice bearing KPC tumor following PBS or pRLN treatment (n = 4). (C) PD-1 expression on F4/80+ macrophages and (D) F4/80+CD206+ macrophages in each treatment group (n = 3). Statistical significance was calculated using t test. *P < 0.05, **P < 0.01, and ***P < 0.001.