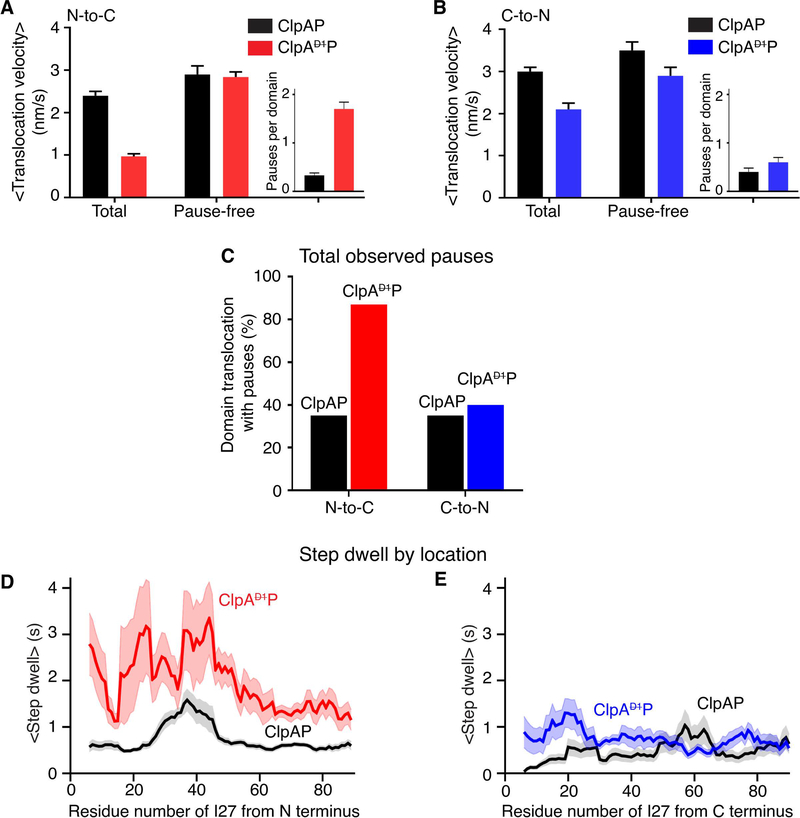
Figure 4: N-to-C and C-to-N translocation.
(A) Average N-to-C translocation velocities and pause-free velocities for ClpAP and ClpAP. The inset shows the average number of pauses for one titin domain. Values are the mean ±1 SEM (For ClpAP, n = 86 events). (B) Average C-to-N translocation velocities and pause-free velocities. Other details are the same as in panel (A). (For ClpAP, n = 44 events) (C) Percentage of events with at least one pause during N-to-C or C-to-N translocation of one titin domain for ClpAP and ClpAP. (D) Average step dwell time(s) at each amino acid during N-to-C translocation of a titin domain by ClpAP (red) or ClpAP (black). The average pre-step dwell time at each amino acid was calculated, and a moving average over a 10-residues window is plotted. The shaded region illustrates ±1 SEM of the moving average at each amino acid. (E) Same analysis as in panel (D) except for C-to-N translocation with ClpAP data colored blue.

