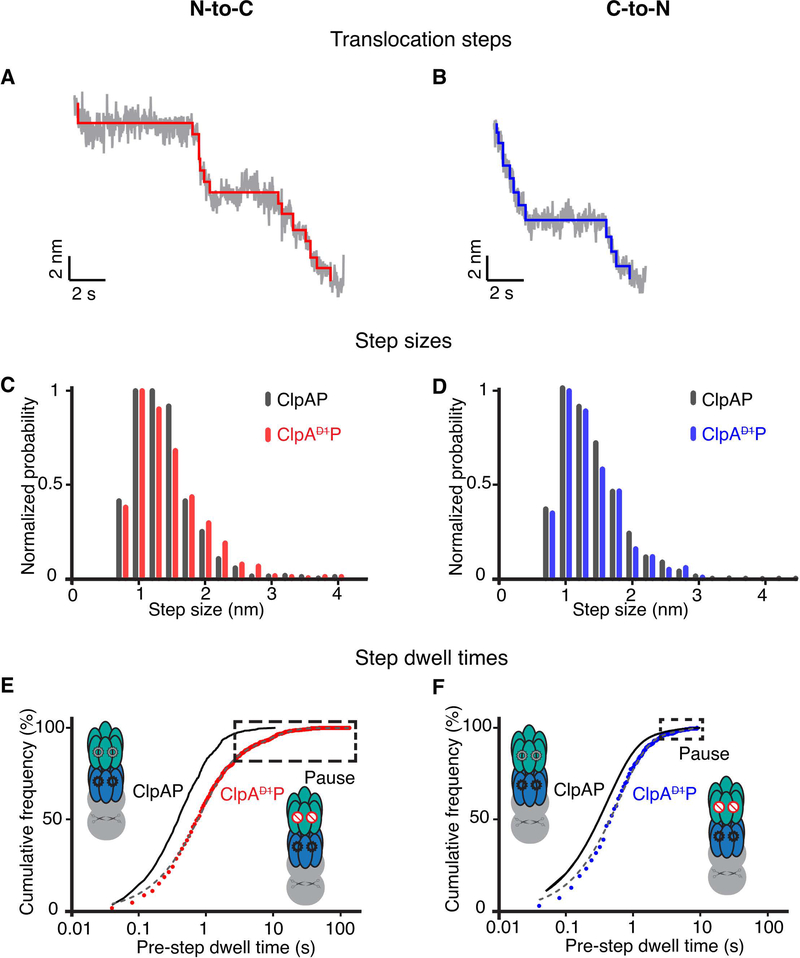
Figure 5:
(A) Representative stepping in ClpAP trajectories during N-to-C translocation. Raw data were decimated to 50 Hz (grey) and the chi-squared fits to the 50 Hz data are shown in red. (B) Representative stepping in ClpAP during C-to-N translocation. Raw traces decimated to 50 Hz are shown in grey and the chi-squared fits are shown in blue. (C) Distribution of step sizes during N-to-C translocation for ClpAP (dark gray) and ClpAP (red). (D) Distribution of step sizes during C-to-N translocation for ClpAP (dark gray) and ClpAP (blue). (E) Cumulative-frequency distributions of pre-step dwell times during N-to-C translocation by ClpAP. (F) Distributions of pre-step dwell times during ClpAP C-to-N translocation. In panels (E) and (F) the distributions are fit by double exponentials (gray dashed line, R2 > 0.99). Pre-step dwell times during translocation by ClpAP are shown in black for comparison (Olivares et al., 2017; Olivares et al., 2014). (For ClpAP: N-to-C, n = 798 events; ClpAP:C-to-N, n = 442 events). Boxes mark pauses, defined as step dwell times ≥ 2.5 s.

