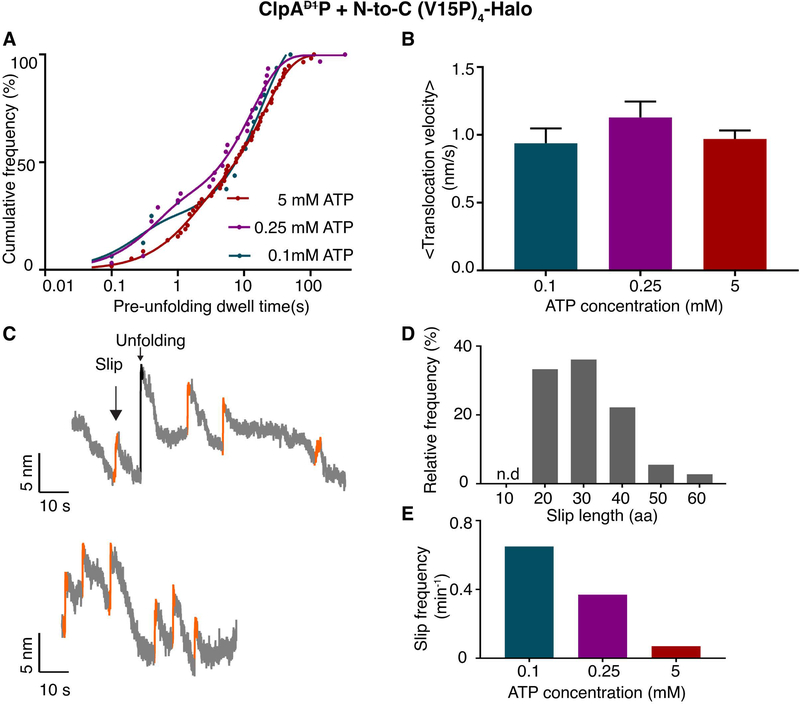
Figure 6:
ATP dependence of ClpAP degradation. (A) Distribution of pre-unfolding dwell times for N-to-C degradation at different ATP concentrations. The solid lines are double-exponential fits. Time constants are 20 ± 0.9 s and 1.4 ± 0.1 s for 5 mM ATP; 13 ± 1.5 s and 0.4 ± 0.1 s for 0.25 mM ATP; and 19 ± 4 s and 0.2 ± 0.1s for 0.1 mM ATP. (Values are mean ± 1 SEM). (B) Average translocation velocities at different ATP concentrations. (Values are mean ± 1 SEM). (C) Representative traces (decimated to 300 Hz) showing slipping events (orange) during N-to-C unfolding and translocation by ClpAP using 0.1 mM ATP. (D) Relative frequency of substrate slips of different lengths (number of amino acids). (E) Total substrate-slip frequencies decrease as the ATP concentration increases.

