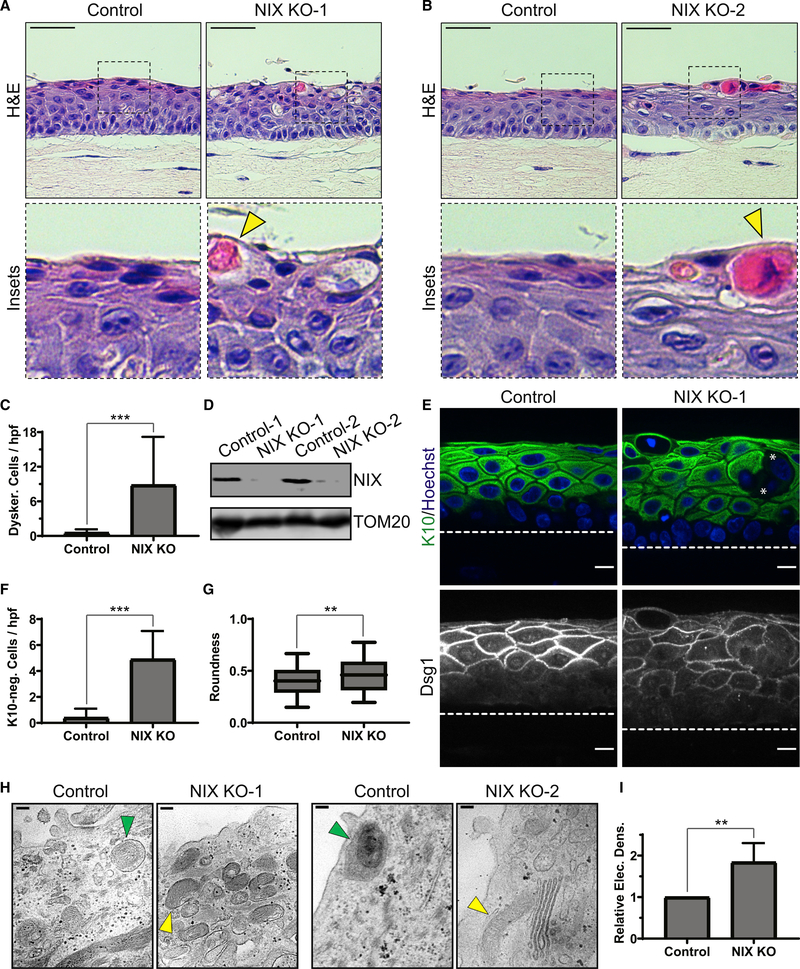
Figure 4. Loss of NIX results in impaired keratinocyte mitophagy and defective epidermal differentiation.
(A and B) H&E staining of organotypic cultures of control versus NIX-depleted THEKs (NIX KO-1 and KO-2), which exhibited swelling, vacuolization, and dyskeratotic cells (yellow arrowheads) in the upper layers.
(C) Quantification of dyskeratotic cells in control versus KO cultures (mean ± SD, n = 53 fields, 3 expts., ***p < 0.0001).
(D) WB of NIX in lysates from control and KO cultures.
(E) IF of K10 and Dsg1, demonstrating altered keratin expression and cell morphology in NIX KO cultures; asterisks mark example suprabasal cells lacking cytoplasmic K10 staining.
(F) Quantification of K10-negative cells in control versus KO cultures (mean ± SD, n = 20 fields, ***p < 0.0001).
(G) Quantification of mean suprabasal cell roundness in control versus KO cultures (line, mean; box, 25th–75th percentile; whiskers, 5th–95th percentile; n = 376 cells from 20 fields, **p = 0.0003).
(H) TEM images of control cultures, showing mitophagic events (green arrowheads) and clearance of membranous organelles in the uppermost layers; NIX-depleted epidermis showed retention of mitochondria (yellow arrowheads).
(I) Quantification of relative electron density of upper layers in control versus KO cultures (mean ± SD, n = 63 fields, 2 KO lines, **p = 0.0015).
Dashed lines mark the bottom of the epidermis. White scale bars, 10 μm; H&E black scale bars, 50 μm; TEM black scale bars, 100 nm.

