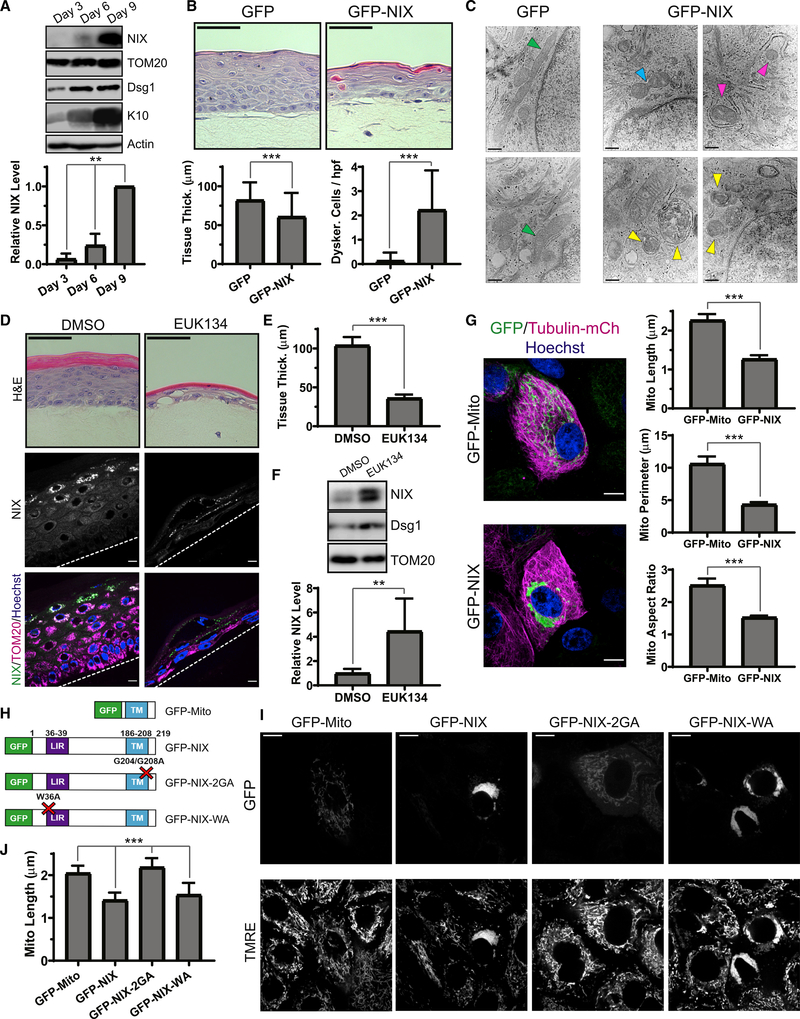
Figure 5. Premature NIX expression induces mitochondrial fragmentation and accelerates epidermal differentiation.
(A) WB of NIX and differentiation markers (Dsg1 and K10) in lysates from epidermal cultures grown for 3, 6, or 9 days and (bottom) quantification of relative NIX expression (mean ± SD; n = 3 expts., **p = 0.0071).
(B) H&E staining of cultures ectopically expressing GFP versus GFP-NIX and (bottom) quantification of tissue thickness (mean ± SD, n = 201 fields, 6 expts., ***p < 0.0001) and dyskeratotic cells (mean ± SD, n = 150 fields, 6 expts., ***p < 0.0001).
(C) TEM images of lower layers in control cultures, showing tubular mitochondria (green arrowheads), and in GFP-NIX-expressing cultures, showing mitochondrial constriction (blue arrowhead), partially engulfed mitochondria (magenta arrowheads), and mitophagic events (yellow arrowheads).
(D) H&E staining of cultures treated with DMSO versus EUK134 and (bottom) IF of NIX and TOM20.
(E) Quantification of tissue thickness in DMSO- and EUK134-treated cultures (mean ± SD, n = 22 fields, ***p < 0.0001).
(F) WB of lysates from cultures treated with DMSO versus EUK134 and (bottom) quantification of relative NIX protein levels (mean ± SD, n = 5 expts., **p = 0.0006).
(G) SDC images of undifferentiated NHEKs transduced with tubulin-mCh and GFP-Mito versus GFP-NIX and (right) quantification of mitochondrial length, perimeter, and AR of GFP-Mito- versus GFP-NIX-positive mitochondria (mean ± SD, n = 78 cells, 3 expts., ***p < 0.0001).
(H) Diagram showing GFP-labeled NIX constructs.
(I) SDC images of NHEKs transduced with GFP-labeled NIX constructs and incubated with TMRE.
(J) Quantification of mitochondrial length in NHEKs expressing NIX constructs (mean ± SD; n = 163 cells, 4 expts., ***p < 0.0001).
Dashed lines mark the bottom of the epidermis. White scale bars, 10 μm; H&E black scale bars, 50 μm; TEM black scale bars, 400 nm.

