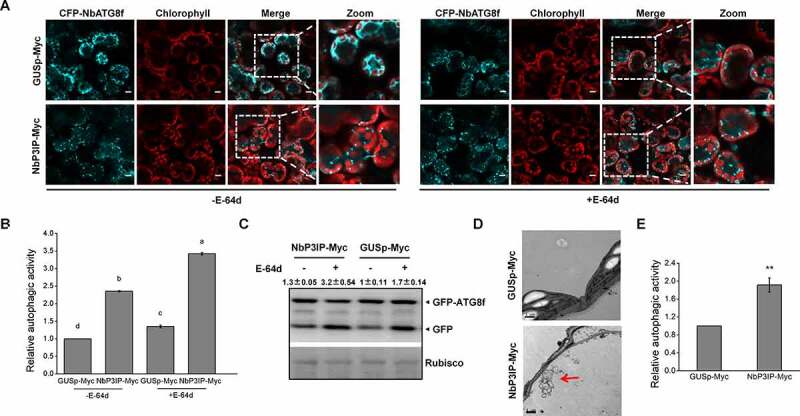
Figure 1.

NbP3IP overexpression activates autophagy. (a) Co-expression of NbP3IP-Myc with CFP-NbATG8f increases the appearance of autophagosomes and autophagic vesicles compared to expression of CFP-NbATG8f with a control protein (GUSp-Myc) with or without (left) E-64d. Images were collected at 48 hpi. 50 μM E-64d was pre-infiltrated at 10 h ahead of imaging. Bars, 10 μm. The picture of chlorophyll is used to show the shape of leave cells. (b) Quantification of increase of autophagic activity in cells imaged in panel A. The autophagic activity was calculated in relation to GUSp-Myc with or without E-64d treated plants. Autophagic bodies were counted from approximately 150 cells for each treatment in three independent experiments. Values represent the mean ± SD. Different letters indicate significant difference (ANOVA, P < 0.05). (c) GFP-ATG8 processing assay in control and NbP3IP-Myc-expressing leaves with or without E-64d treatment. Arrowheads indicate the free GFP band and GFP-ATG8f band respectively. The value represents ratio of GFP/GFP-ATG8f relative to rubisco, and the relative levels were calculated in relation to GUSp-Myc without E-64d treated. GFP-ATG8f 40 kD, GFP 27 kD. (d) Examination of autophagic vesicle production by TEM of leaf cells from plants infiltrated with GUSp-Myc or NbP3IP-Myc. Samples collected for processing at 60 hpi. Typical autophagic structures are indicated with red arrows. Bars, 1 μm. (e) Quantification of autophagic vesicles from approximately 20 cells present in TEM images. The autophagic activity is calculated relative to GUSp-Myc-treated plants. The value represents the mean ± SD from three independent experiments. Double asterisks indicate P < 0.01 of significant difference between GUSp-Myc and NbP3IP-Myc treatments (Student’s t-test, two-sided)
