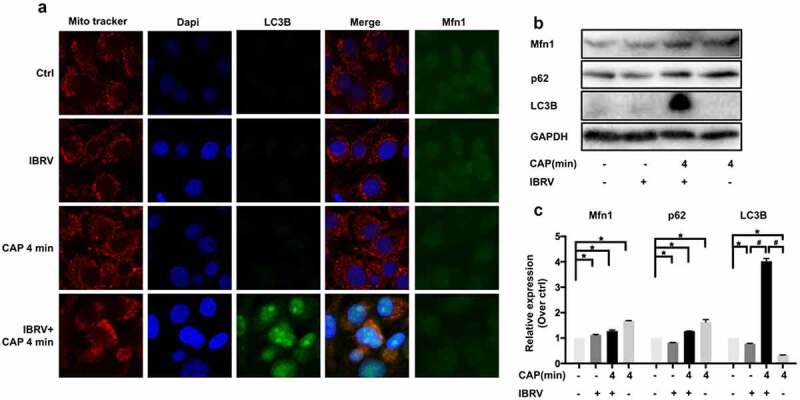
Figure 5.

Comparisons on selective autophagy in cells on IBRV infection and/or CAP exposure. (a) Immunofluorescence imaging. (b) Western blot on key proteins in selective autophagy and (c) their quantifications

Comparisons on selective autophagy in cells on IBRV infection and/or CAP exposure. (a) Immunofluorescence imaging. (b) Western blot on key proteins in selective autophagy and (c) their quantifications