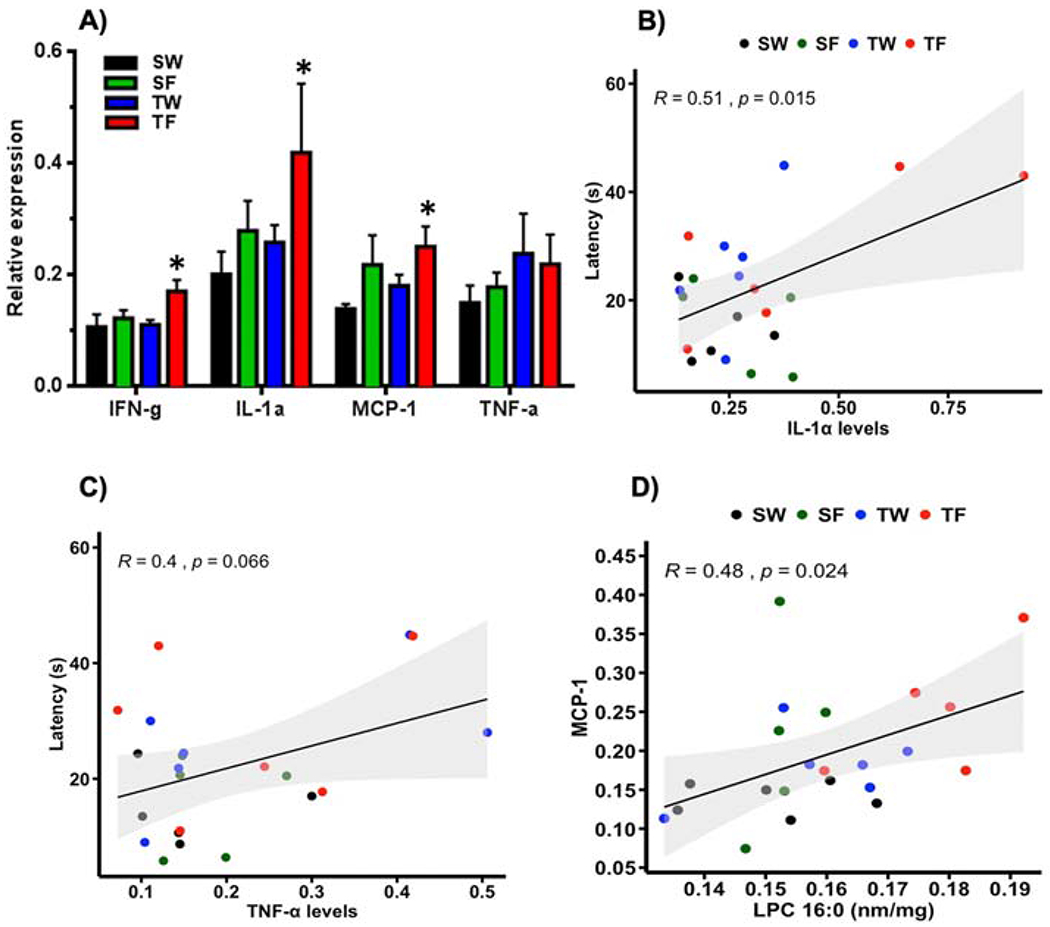
Figure 4. Effects of TBI and fructose on pro-inflammatory cytokines (IFN-γ, IL-1α, MCP-1, TNF-α) in the liver.

(A); 2-way ANOVA with Fisher’s LSD post-test (*p<0.05 vs SW group). (B) Correlation analysis using the latency as a variable shows association between IL-1α (R=0.51, p=0.015) and TNF-α (C, R=0.40, p=0.06) levels with memory performance. (D) Correlation analysis shows association between MCP-1 and LPC (16:0) levels (R= 0.48, p=0.024). Pearson correlation, n=5-6 per group.
