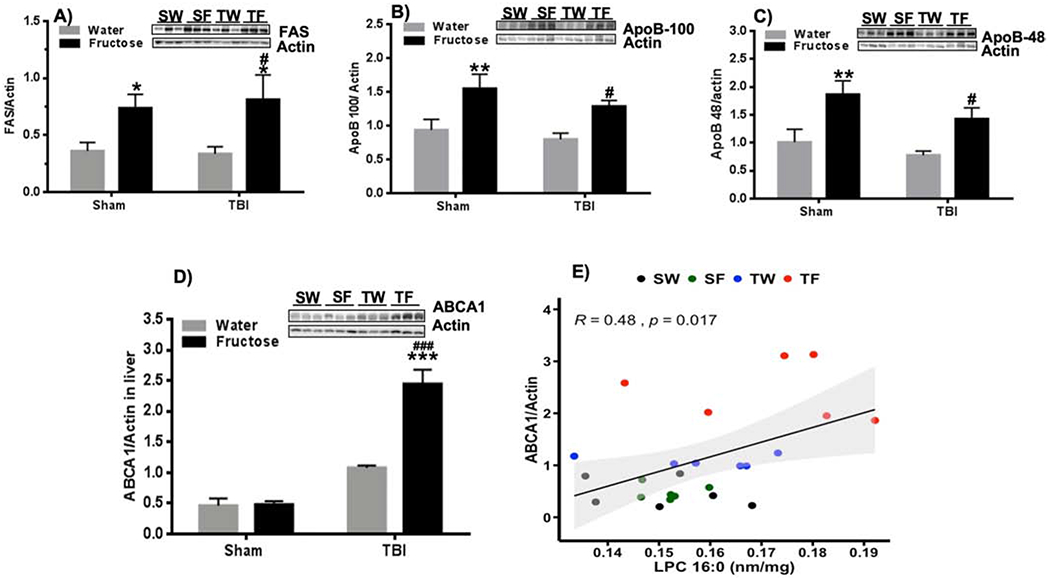
Figure 6. Lipid metabolism in the liver in response to TBI and fructose.

(A) Quantification of Fatty acid synthase (FAS; A), ApoB-100 (B), (C) ApoB-48 (C), and ABCA1 (D) in the liver. n=6 per group. 2-way ANOVA with Fisher’s LSD posttest, (*p<0.05, **p<0.01, *** p<0.001 vs SW-group, #p<0.05, ### p<0.001 vs TW-group). The uncropped western blots are shown in the supplementary information (Supplementary Figure 2). (E) Correlation analysis shows association between ratio ABCA1/actin and LPC 16:0 levels (R= 0.48, p=0.017).
