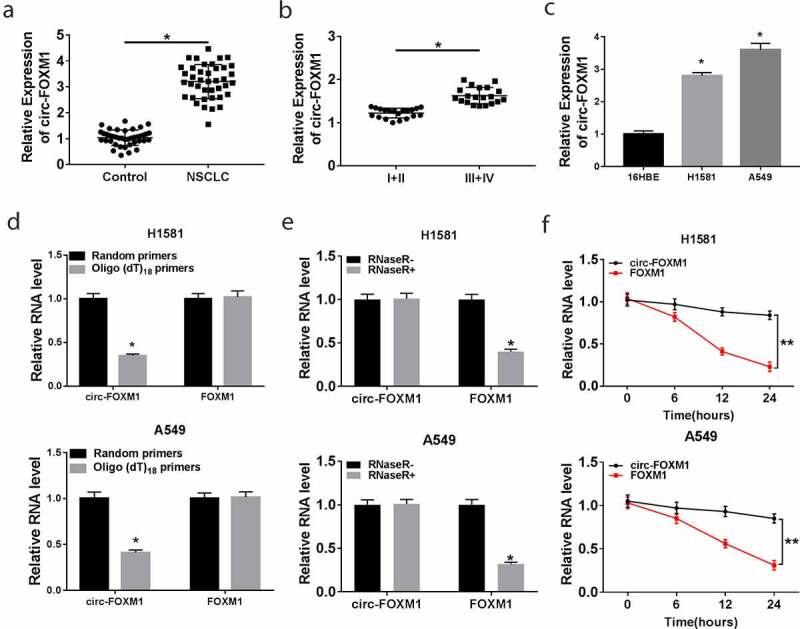
Figure 1.

The level of circ-FOXM1 in NSCLC tissues and cells. (a) The level of circ-FOXM1 was detected by RT-qPCR in NSCLC tissues and adjacent normal tissues; Student’s t-test was performed for statistical analysis. (b) Circ-FOXM1 expression was examined in tissues isolated from various TNM stage (I+ II, III+IV) NSCLC patients by RT-qPCR; Student’s t-test was performed for statistical analysis. (c) The level of circ-FOXM1 was determined in NSCLC cells and normal cells; ANOVA followed via Tukey’s test was performed for statistical analysis. (d) Random hexamer or oligo (dT) primers were used to measure the levels of circ-FOXM1 and mRNA-FOXM1; Student’s t-test was performed for statistical analysis. (e and f) The levels of circ-FOXM1 and mRNA-FOXM1 were examined in NSCLC cells after the treatment of RNase R; Student’s t-test was performed for statistical analysis. *P < 0.05
