Figure 6.

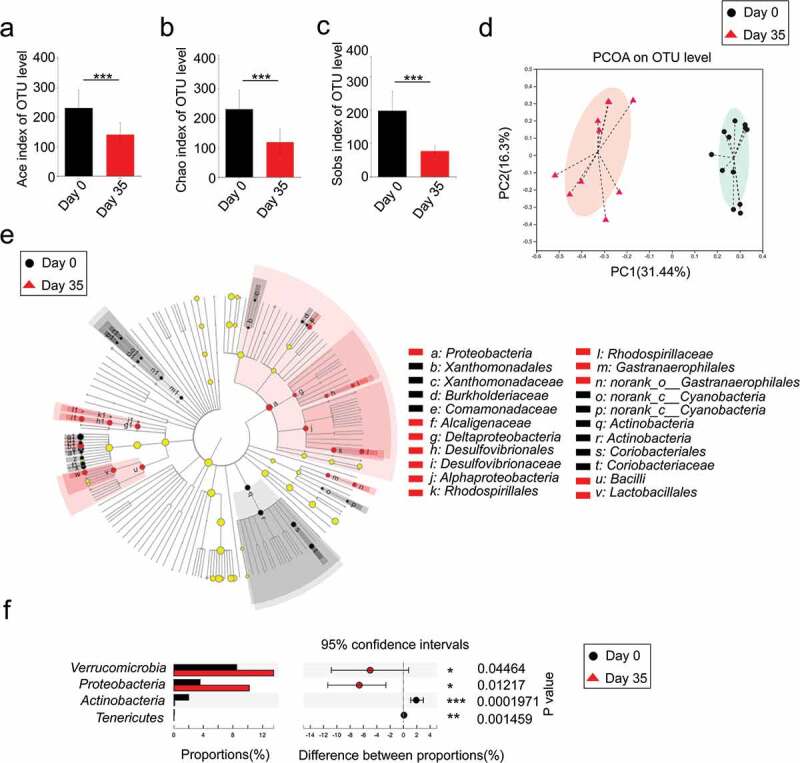
Dextran sulfate sodium decreased microbial diversity and reshaped the microbial community
A microbiome analysis was conducted using stool samples collected from mice on day 0 and day 35 with DSS. (a-c) The α-diversity of the gut microbiome, determined by the Ace, Chao and Sobs diversity index of the primary day 0 group compared with the day 35 group with DSS. (d) The principal coordinate analysis (PCoA) plot shows the β-diversity of the gut microbiome. (e) Bacterial taxa identified as differentially abundant between groups according to linear discriminant analysis effect size (LEfSe). The bacterial taxa of the primary day 0 group were compared with those of the day 35 group with DSS ranging from phylum to family. Black indicates bacterial taxa whose abundance was higher in the day 0 group and red indicates bacterial taxa whose abundance was higher in the other group. (f) Significant phyla alterations in the primary day 0 group and the day 35 group with DSS. n = 9–11. *p < .05, ***p < .001, ****p < .0001 (unpaired t test or Wilcoxon rank-sum test).
