
Figure 2.
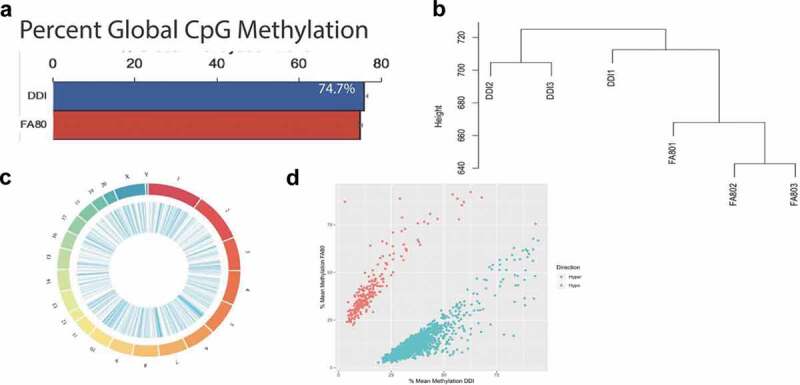
Axonal regeneration-related changes in 5mC after ancestral folate supplementation. (a) Bar graph depicts the per cent global 5mC levels in samples with enhanced axonal regeneration samples (FA80) and low axonal regeneration samples (DDI). (b) Unsupervised hierarchical clustering using global 5mC levels from samples that exhibit enhanced axonal regeneration (FA80) and low axonal regeneration (DDI). (c) Circos plot depicting the chromosomes (Outer ring) of the rat genome that were examined by whole-genome bisulphite sequencing. Each chromosomes is a different colour and the chromosome size is represented by the bar length. (Inner ring) Blue lines represent the relative location of differentially methylated regions (DMRs) across all chromosomes. (d) Scatterplot depicts the level of differential methylation between sample groups. The average per cent DMR methylation of the enhanced axonal regeneration samples (FA80; y-axis) and low axonal regeneration samples (DDI; x-axis) are shown. Hyper- and hypo-DMRs are shown in red and blue, respectively