
Figure 3.
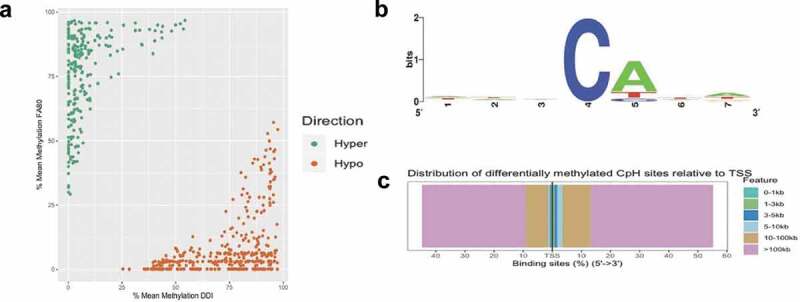
Axonal regeneration-related changes in 5mC at CpH dinucleotides after ancestral folate supplementation. (a) Scatterplot depicts the level of differential methylation between sample groups. The average per cent DMR methylation of the enhanced axonal regeneration samples (FA80; y-axis) and low axonal regeneration samples (DDI; x-axis) are shown. Hyper- and hypo-DMRs are shown in green and orange, respectively. (b) A sequence motif plot depicts the relative abundance of nucleotides immediately flanking the DmCH site. The asterisk indicates that the CpA context is significantly more common compared to CpT or CpC (P-value < 0.05). (c) Modified bar plot depicts the relative abundances of DmCH sites in relation to gene transcription start sites (TSSs). The distance (legend colours) upstream or downstream of the TSS is shown from 5ʹ to 3ʹ (x-axis)