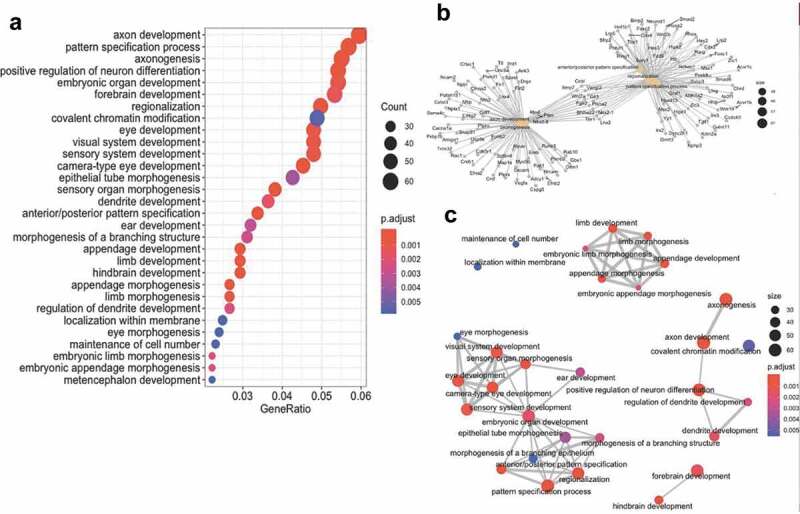
Figure 6.

Combined cytosine modification-associated genes pathways analysis. (a) Dot plot illustrating the top 30 gene ontological (GO) biological processes linked with the cytosine modification-associated genes (ordered by statistical significance from the top of the figure). The specific term (y-axis) and the ratio of genes contributing to each GO term (x-axis) are shown. The size of the dot is representative of the relative number of cytosine modification-associated genes contributing to each term. The colour of each dot represents the FDR P-value, shown in the legend, as determined by a Fischer test. (b) A gene-concept network plot shows the top five gene ontology terms (beige), the genes (grey) associated with each term, and the interconnectivity between genes and processes (lines). The size of the beige dot relates to the number of cytosine modification-associated genes contributing to that term. (c) An enrichment map plot depicts the connectivity of terms with each other, with hubs of similar processes clustering away from each other. Node (balls) sizes represent the relative number of cytosine modification-associated genes contributing to each term, while the colour represents the FDR P-value, shown in the legend, as determined by a Fischer test. The size of the edges (grey lines) depicts the strength of relatedness between terms
