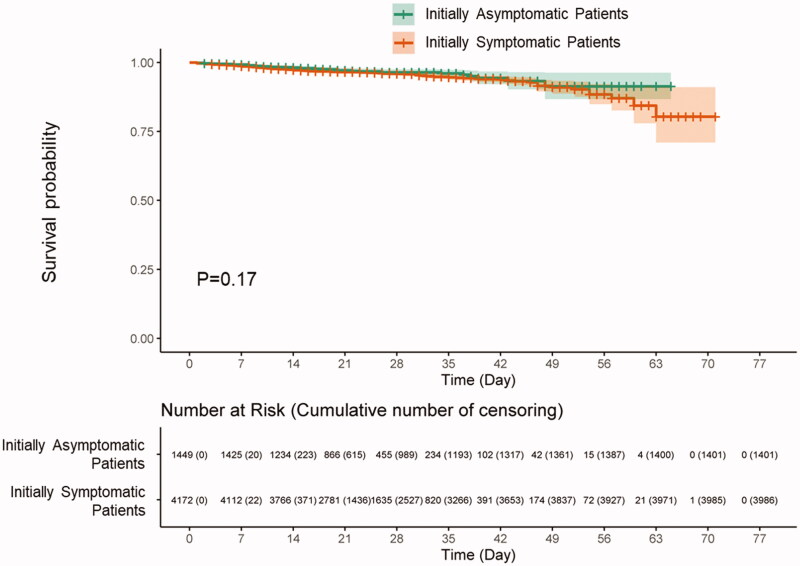
Figure 1.
Kaplan–Meier survival plots for mortality according to the presence of initial symptoms. The figure displays the Kaplan–Meier survival plots of mortality between initially symptomatic and asymptomatic COVID-19 patients. There was no statistically significant difference between groups (p = .17).

