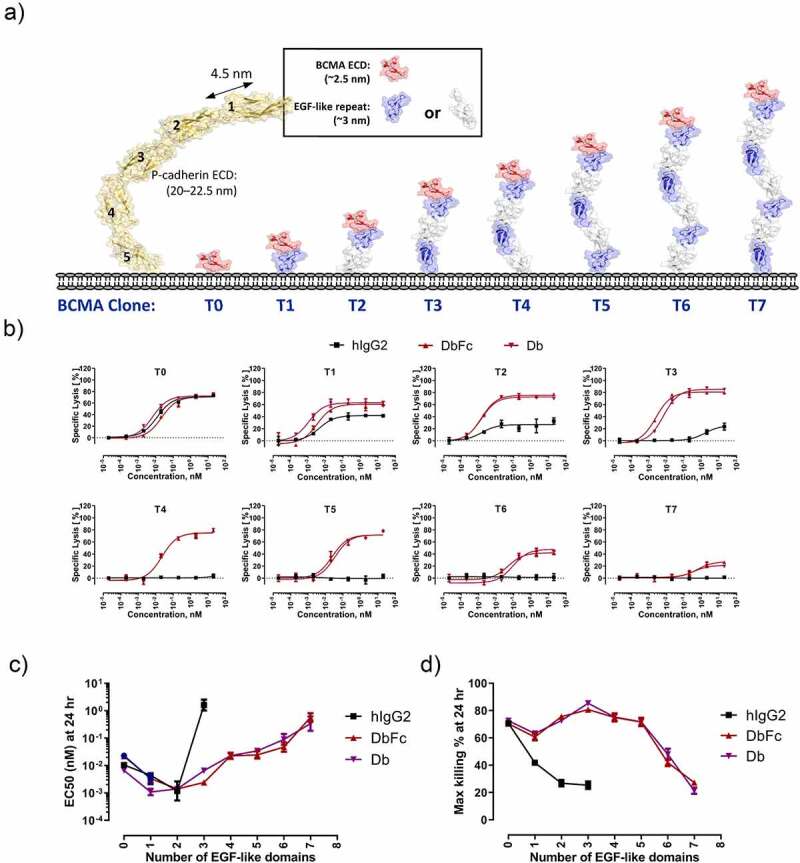
Figure 2.

Differential cytotoxicity profiles of bispecific anti-BCMA/anti-CD3 IgG2, DbFc, and Db on engineered cell lines where BCMA is tethered to the cell surface with increasing distance from the membrane. (a) Schematic diagram of T0-T7 cell lines, with P-cadherin ectodomain structure depicted alongside to show relative dimensions; (b) Cytotoxicity of aforementioned four bispecific molecules on the eight cell lines at 24-hour timepoint; (c) EC50 values as a function of the number of EGF-like domains; (d) Maximal killing (Emax) values as a function of the number of EGF-like domains
