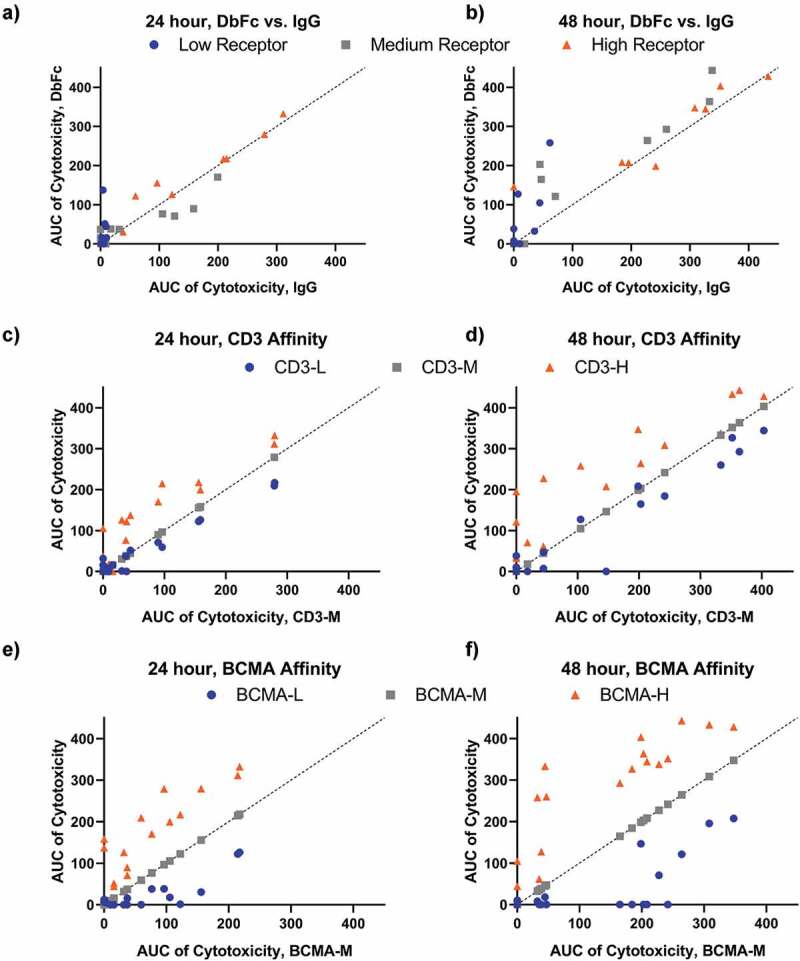
Figure 5.

The influence of receptor density, antigen-binding affinities, molecular format, and cytotoxicity kinetics, as represented by AUC (raw data in Supplementary Figure 5). Dashed lines represent y = x.(a-b) Pair-wise comparison of cytotoxicity of DbFc versus IgG (with the same antigen-binding arms) on cell lines with low, medium, and high receptor expression at 24 and 48 h timepoints; (c–d) Pair-wise comparison of cytotoxicity of CD3 affinity variants at 24 and 48 h timepoints, with all other parameters (cell line, affinity to BCMA, molecular format, receptor density) being the same; (e–f) Pair-wise comparison of cytotoxicity of BCMA affinity variants at 24 and 48 h timepoints, with all other parameters (cell line, affinity to CD3, molecular format, receptor density) being the same
