
Figure 6.
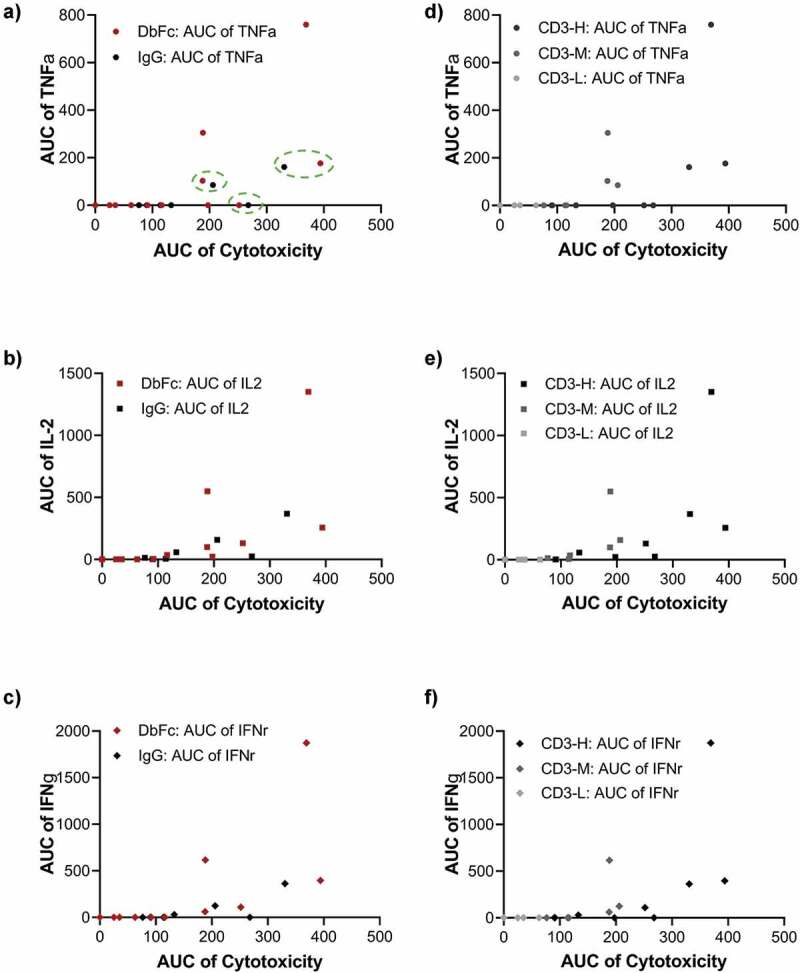
Deconvolution of cytotoxicity and cytokine release is achievable through a combination of molecular format and antigen epitope location. (a-c) Correlation of cytotoxicity versus the release of cytokines TNFα, IL-2, and IFNγ shown as AUC scatter plots, with data sets grouped based on molecular format; (d-f) Correlation of cytotoxicity versus the release of cytokines TNFα, IL-2, and IFNγ shown as AUC scatter plots, with data sets grouped based on CD3 binding affinity