
Figure 4.
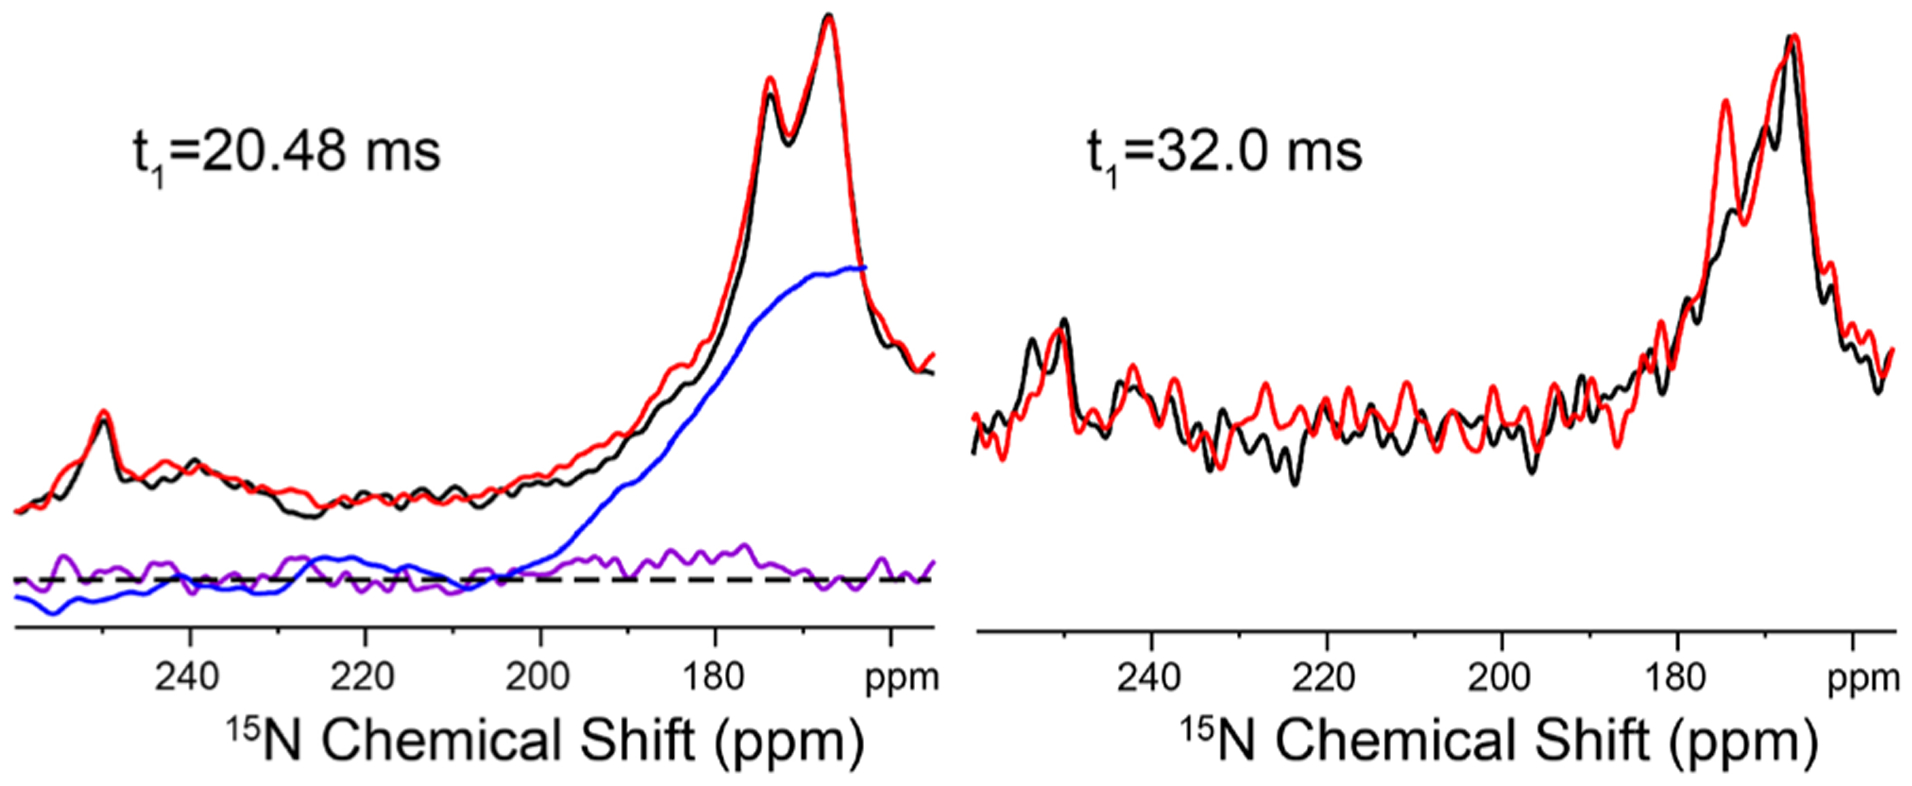
Expanded 15N doubly spin–echoed spectra of the His37-labeled M2FL (pH 6.2) in DOPC/DOPE liposomes with (red) and without (black) the J-refocusing π/2 pulse at different spin–echo time t1. The subtraction of the black from red spectra is shown in purple with dashed lines indicating the zero reference. The blue line shows the integration of the difference spectrum from 260 to 164 ppm.