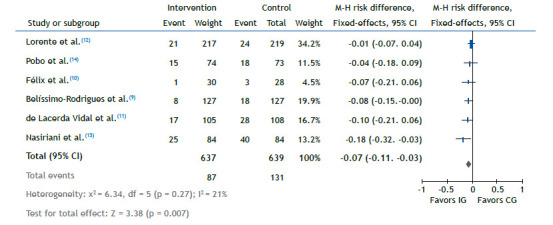
Figure 4. Comparison between the intervention and control groups in relation to the decrease in the prevalence of ventilator-associated pneumonia, fixed-effects model. M-H: Mantel-Haenszel (method); df: degrees of freedom; IG: intervention group; and CG: control group.

