
Figure 1.
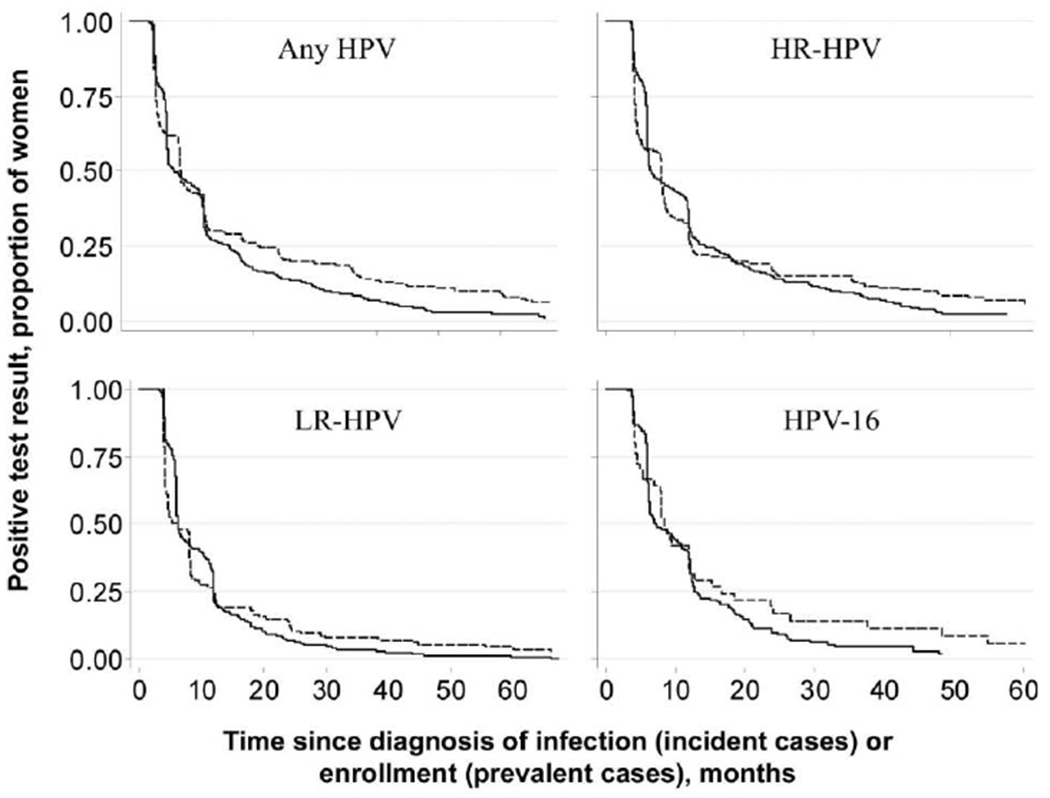
Kaplan-Meier curves for time to clearance of prevalent and incident human papillomavirus (HPV) infections. See the text for descriptions of HPVs with a high oncogenic risk (HR) and those with a low oncogenic risk (LR). Solid lines denote incident infection, and dashed lines denote prevalent infection.