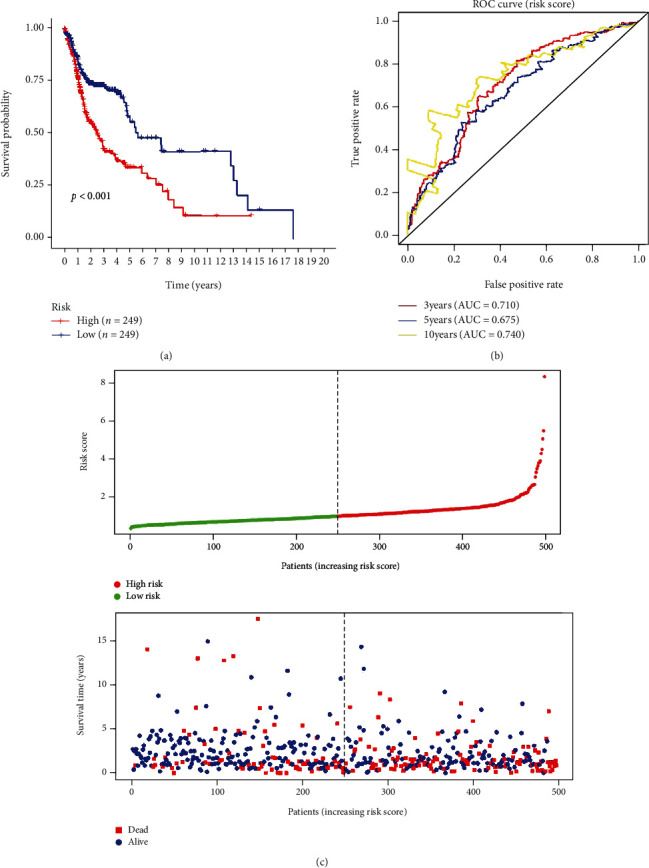
Figure 3.

Risk score based on the 6 glycolysis-related gene prognostic risk markers in patients with HNSCC. (a) Kaplan-Meier curve of OS in the high- and low-risk groups. (b) Time-dependent ROC curves of the 6 glycolysis-related gene signatures for prediction of 3-, 5-, and 10-year OS. (c) The distribution of the 6 glycolysis-related gene risk scores and survival status for each patient.
