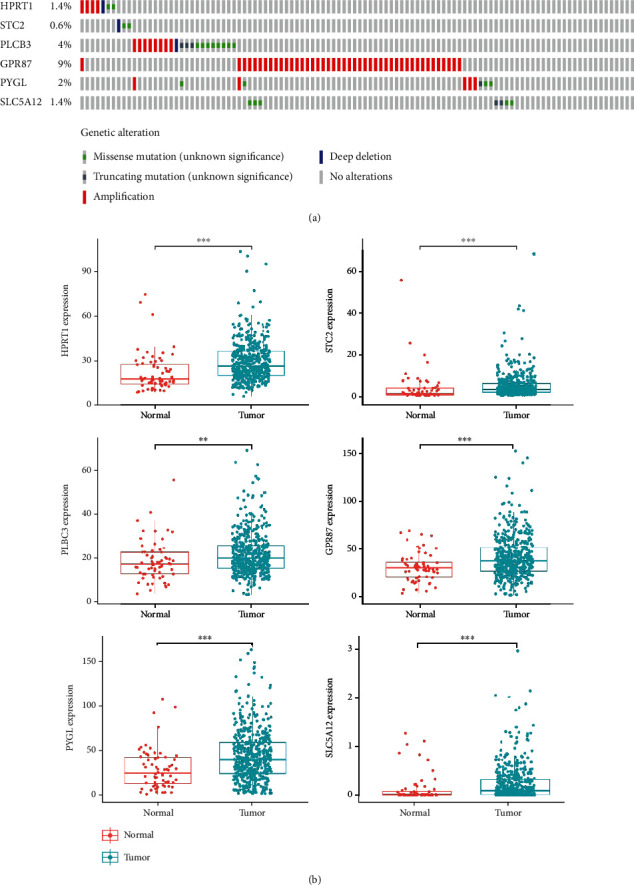
Figure 6.

Analysis of the expression of 6 genes in the sample (a) to screen the mutations of genes in sample of M cancer patients (b); the differential expression analysis of the 6 screened genes (∗means < 0.05, ∗∗means < 0.01, and ∗∗∗means < 0.001).
