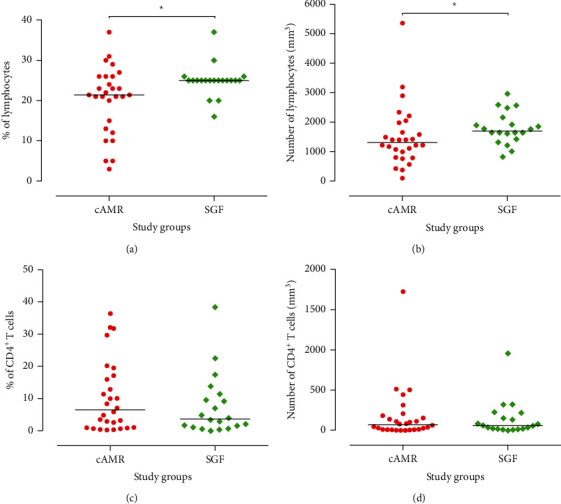
Figure 3.

Lymphocyte and CD4+ T cell quantitative analysis in the study groups. Flow cytometric analysis of peripheral blood mononuclear cells (PBMCs) from stable graft function (SGF, n = 20) and chronic antibody-mediated rejection (cAMR, n = 28) patients. The percentage and number of (a, b) lymphocytes and (c, d) CD4+ T cells are displayed as individual values in each group. Intergroup differences were assessed by the Mann–Whitney U test. Horizontal lines show the median value (∗P < 0.05).
