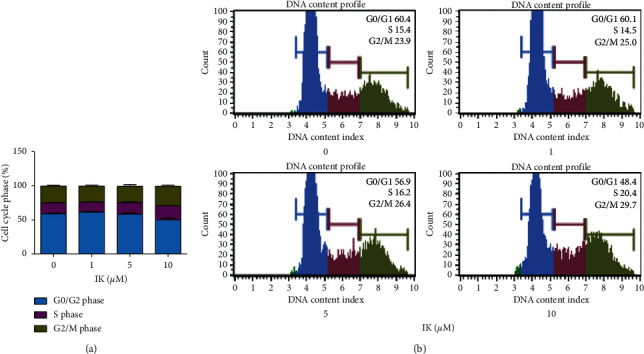
Figure 4.

Effects of IK on cell cycle progression in HaCaT cells. (a) Cell cycle ratio of HaCaT cells after treatment with IK. (b) A plot of the cell cycle pattern of HaCaT cells under different treatment concentrations of IK. The results are presented as the means ± SD of three independent experiments.
