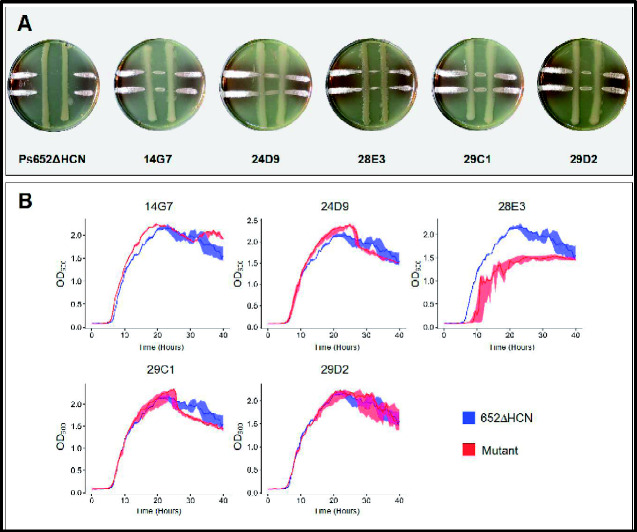
Figure 3.
(A) Cross-streak assays of five Pseudomonas sp. Ps652ΔHCN mutants (vertical lines) against S. scabies 87-22 (horizontal lines). Images are representative of 3 replicates after incubation for five days. (B) Growth curves of Pseudomonas sp. Ps652ΔHCN (control) and five transposon mutants. Solid lines represent the median at each time point and the shaded area represent the maximum and minimum values; n = 3.

