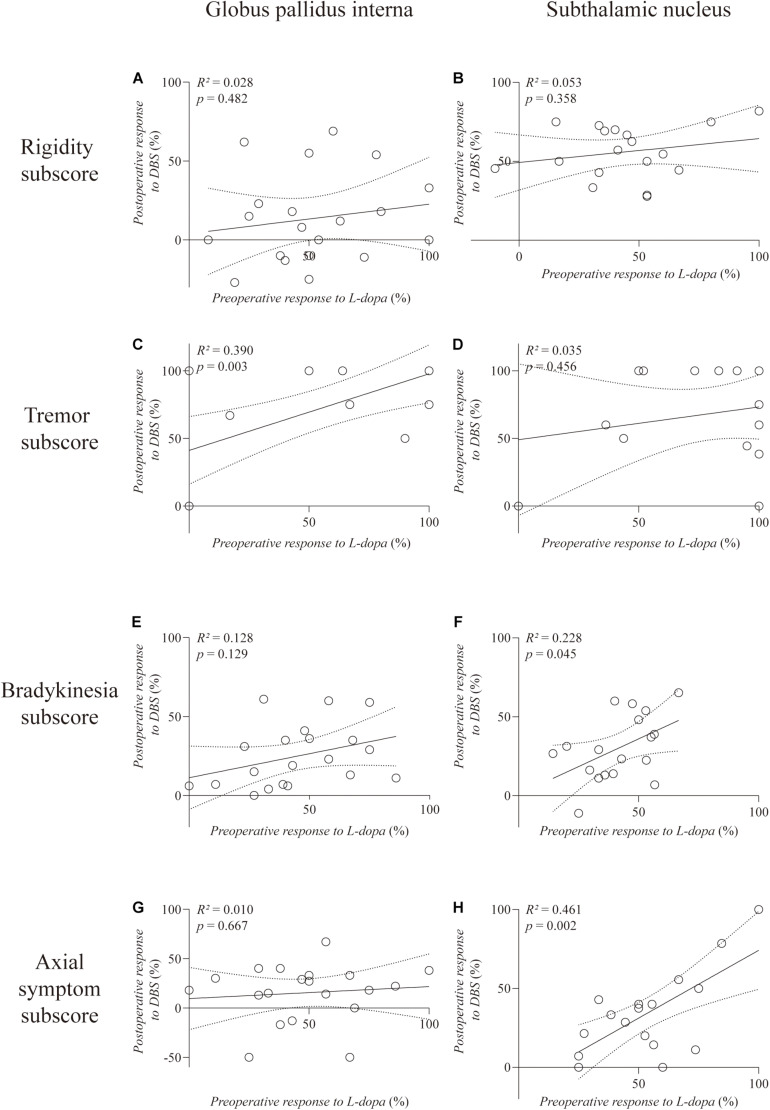
FIGURE 2.
Linear regression between preoperative L-dopa challenge responsiveness and DBS responsiveness on the MDS UPDRS-III subscores. The left column is the GPi group and the right column is the STN group. The rigidity (A,B), tremor (C,D), bradykinesia (E,F), and axial symptom (G,H) subscores are, respectively, plotted. Individual data are represented as black circles. The 95% confidence interval for the linear regression is shown as dotted lines.

