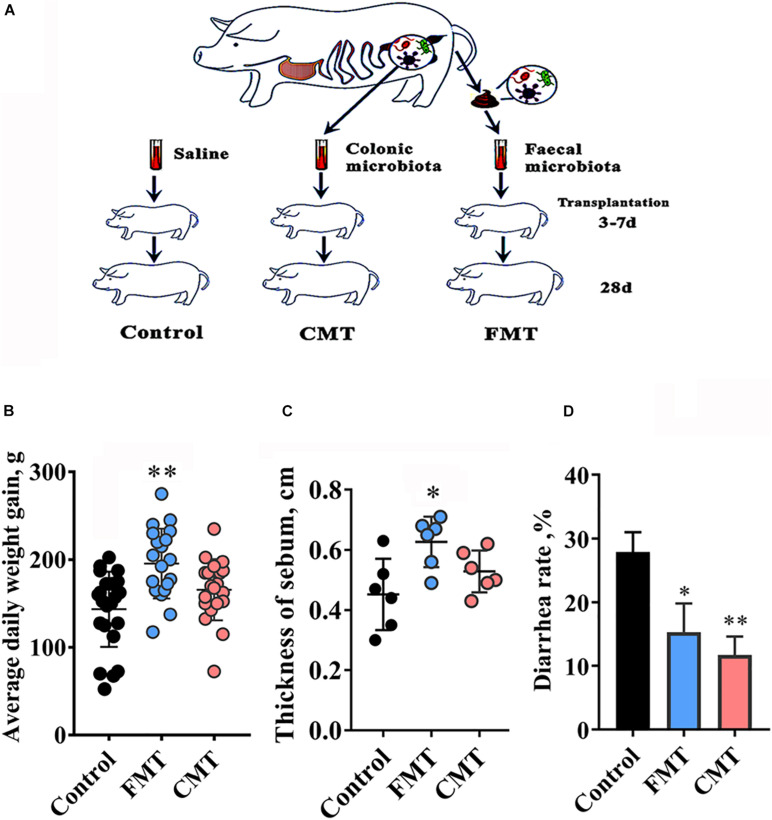
FIGURE 1.
Microbiota transplantation improved growth performance of recipient piglets. (A) Schematic of the experimental design. (B) The average daily gain of piglets from day 7 to day 28; control group, n = 23; FMT group, n = 22; CMT group, n = 21; (C) Neck subcutaneous fat thickness in piglets on day 28 (n = 6). (D) Diarrhea rate of piglets during the experiment. CMT, colonic microbiota transplantation; FMT, fecal microbiota transplantation. The data are presented as the mean ± S.D. ∗∗ Indicates P < 0.01, and ∗ indicates P < 0.05 compared with the control.

