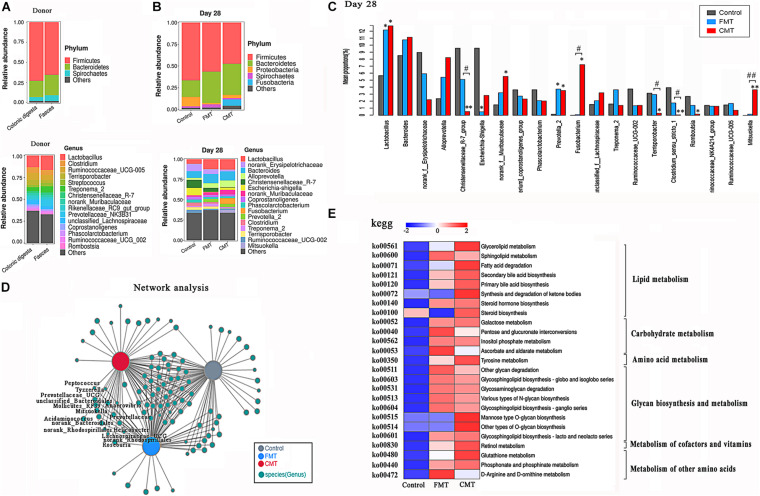
FIGURE 6.
Microbiota transplantation optimized the structure of the intestinal microbiota. (A) Bacterial composition profiles of the feces and colonic digesta of the adult donor pig at the phylum and genus levels (n = 3). (B) Bacterial composition profiles of the feces of the piglets at the phylum and genus levels (n = 6). (C) The differences in the 20 top bacteria genera with high abundance between different piglets were compared by the Kruskal–Wallis test (n = 6); ** indicates P < 0.01, and * indicates P < 0.05 compared with the control; ## indicates P < 0.01, and # indicates P < 0.05 between the FMT and CMT groups. (D) Co-occurrence network analysis of the gut bacteria (genus level) in different piglets on day 28. (E) Comparison of the abundances of KEGG pathways (metabolism, level 3) in different pigs. The functional contributions of the gut microbiota were assessed using the PICRUSt2 tool. Red indicates a high level, and blue indicates a low level.

