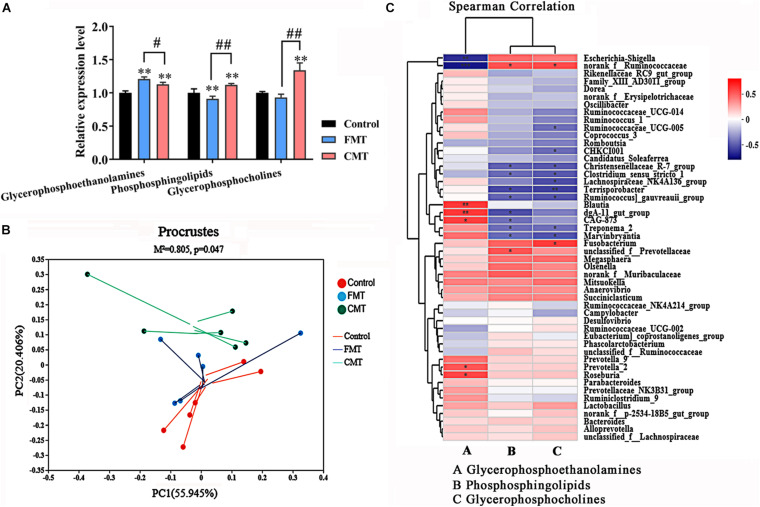
FIGURE 9.
Corrections between intestinal microbiota and lipids metabolism. (A) Composition of the three major altered lipid species in the different piglets (n = 6); ** indicates P < 0.01 with the control, ## indicates P < 0.01 and # indicates P < 0.05 between the FMT and CMT groups. (B) Procrustes analysis shows a significant correlation between lipid profiles and the microbial community. (C) Heatmap of Spearman’s correlation coefficients between the intestinal microbiota and the three major altered lipid species. The colors range from blue (negative correlations) to red (positive correlations). Significant correlations are noted by ** P < 0.01 and * P < 0.05.

