Fig. 4.
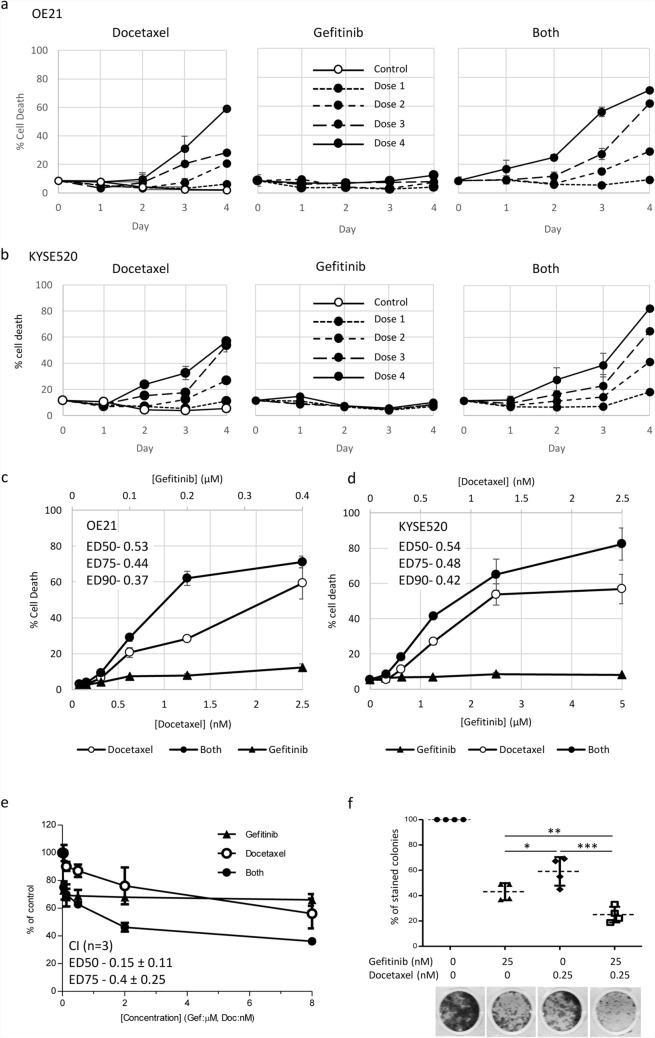
Docetaxel in combination with gefitinib synergistically enhances ESCC cell death. Cytotoxicity of drug treatments (docetaxel alone, gefitinib alone or gefitinib plus docetaxel combination) on the ESCC cell lines OE21 (a, c) and KYSE520 (b, d) was assessed by CellTox™ green assay and imaging (IncuCyte® Zoom). a, b Time course of treatment: cells were treated for 4 days with solvent (control) increasing doses of docetaxel (OE21 and KYSE520: dose 1 = 0.3215 nM; dose 2 = 0.625 nM; dose 3 = 1.25 nM; dose 4 = 2.5 nM), gefitinib (sensitive line OE21: dose 1 = 0.05 µM; dose 2 = 0.1 µM; dose 3 = 0.2 µM;, dose 4 = 0.4 µM and resistant line KYSE520: dose 1 = 1.25 µM; dose 2 = 2.5 µM; dose 3 = 5 µM;, dose 4 = 10 µM) or both drugs combined (both). c, d Endpoint IncuCyte® data from day 4 are presented as dose response curves in OE21 (c) and KYSE520 (d) (mean ± SEM of at least three replicate wells, 4 fields per well of a representative assay). Synergistic combination indices at effective dose 50%, 75% and 90% (ED50, ED75 and ED90) are indicated. e Five-day TE8 3-D anchorage independent spheroid assays treated with equimolar fourfold dilution series of gefitinib (from 8 µM) and docetaxel (from 8 nM) as single agents or in combination. Synergy ED50 and ED75 CI values were calculated using CalcuSyn and are presented as the mean CI ± SD from three independent assays. (ED90s were not reached and calculated CI ED90 were variable across independent assays). f OE21 colony formation assay using docetaxel and gefitinib doses selected to induce approximately 50% reduction in colony number as a monotherapy, and in combination. Statistical comparisons were performed using Graphpad prism software (ANOVA plus Bonferroni correction for multiple testing from n = 4 independent assays; *p = 0.01–0.05, **p = 0.001–0.01, ***p = < 0.001)

