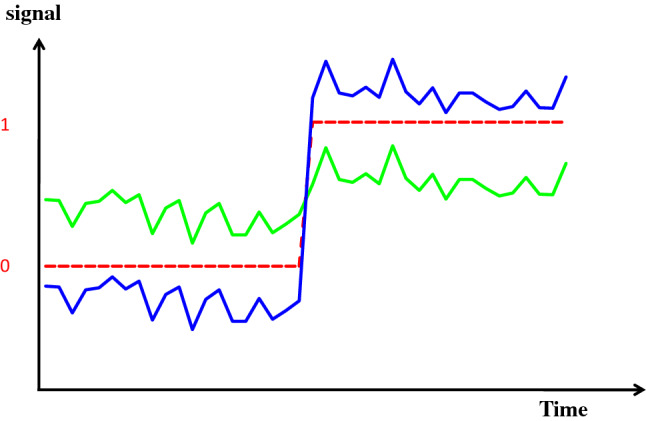
Fig. 2.

Schematic representation of amplification. In green the original transducer output is shown, with a signal-to-noise ratio = 10. The change of the signal represented in the middle of the figure is below the resolution of the analog-to-digital converter (with schematically 0,1 response represented by the red dotted line). In blue, the signal has been amplified (x5). The change of the signal can be perceived by the analog-to-digital converter. Since the noise (external noise) is not amplified, the signal-to-noise ratio is also improved by a factor of 5, allowing easier filtration
