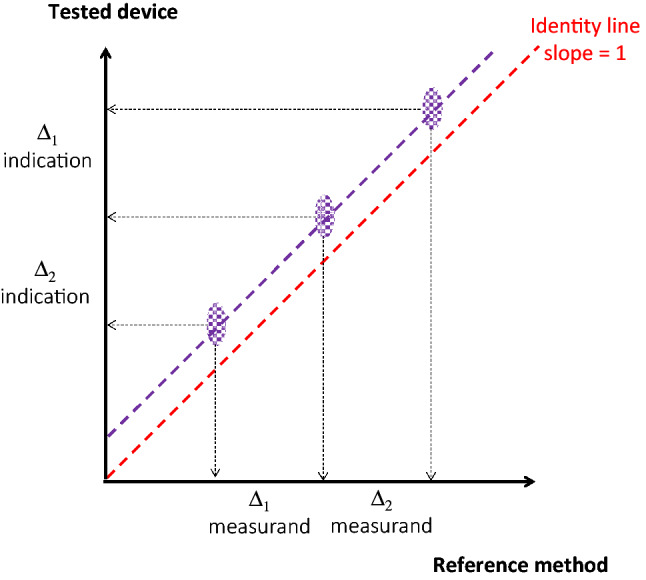
Fig. 7.

Comparison between the test device and the reference method, based on three sets of paired measurements representing the whole measuring interval of cardiac output (1.5–4.5 L/min). Purple areas show the uncertainty as derived by the reference 2 SEM on the x-axis and the test device 2 SEM on the y-axis. The data of the central point are those shown in Fig. 5. In this example, the precisions of both technologies remain constant over the measuring interval (same purple areas). The test device shows a good sensitivity (Δ1 indication/Δ1 measurand = Δ2 indication/Δ2 measurand = 1) with a regression curve (purple dotted line) close to the perfect identity shown by the red dotted line. Therefore, the instrumental bias shown by the test device is constant (offset)
