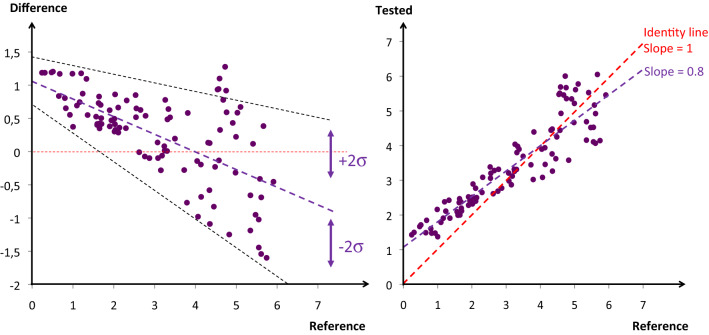
Fig. 8.
On the left panel a modified Bland & Altman representation is shown. One hundred inter- and intra-patients paired measurements are reported. In this example, indicating the mean bias and the variability of the bias, the instrumental bias of the test device is decreasing from low to high values of the measurand. In addition, the uncertainty (combining imprecision, non-sensitivity, and interpatient variability of the bias) is increasing proportionally to the value of the measurand. On the right panel, same data reported on a regression plot showing the same non-idealities (with different scales). The imperfect sensitivity is shown by a regression slope < 1 and indicates the need for a better gain

