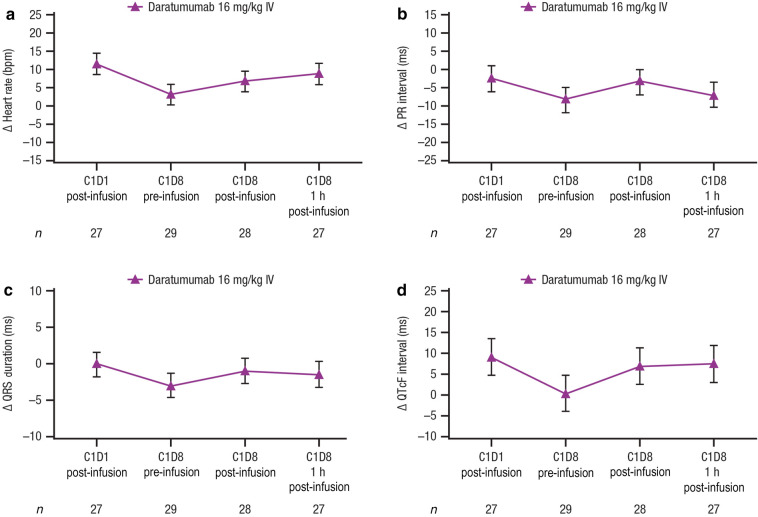
Fig. 2.
Time-point analyses. Mean change from baseline in a heart rate, b PR interval, c QRS duration, and d QTcF interval. Values are means ± 90% CIs; estimates and CIs are model based. PR interval time from onset of P wave to the start of the QRS complex, QRS duration interval of time between Q wave and S wave, QTcF interval QT interval corrected for heart rate using Fridericia’s formula, CI confidence interval, IV intravenously, bpm beats per minute, C Cycle, D Dose

