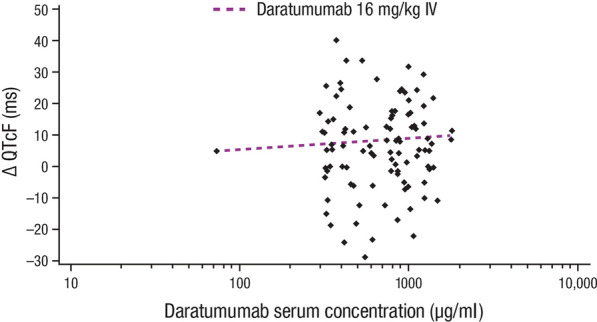
Fig. 3.

Relationship between QTcF change from baseline and serum concentration of daratumumab. Shown is a scatterplot of all QTcF change from baseline and daratumumab serum concentration pairs at each time point. Each of the 31 patients could have up to 4 pairs for each of the time points: Cycle 1 Dose 1 post-infusion, Cycle 1 Dose 8 pre-infusion, Cycle 1 Dose 8 post-infusion, and Cycle 1 Dose 8 1 h post-infusion. The prediction line was based on a mixed-effects regression model using concentration, treatment dose, and least square mean estimates of the time values. QTcF interval QT interval corrected for heart rate using Fridericia’s formula, IV intravenously
