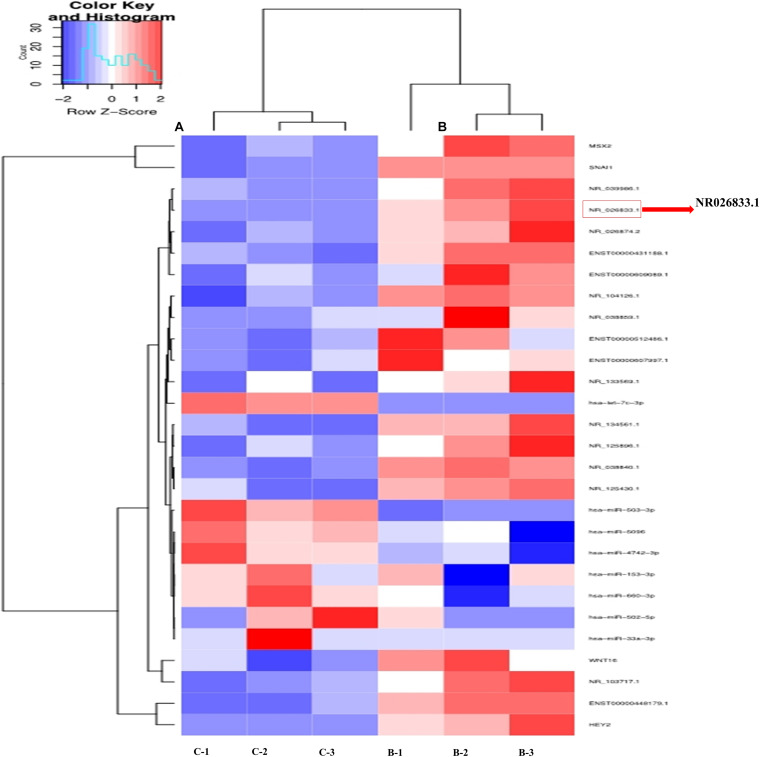
FIGURE 6.
Hierarchical clustering analysis of lncRNA and microRNA expression in primary human EVT cells treated with Ctrl (n = 3) or 25 ng/mL BMP2 (n = 3). Each row represents one type of RNA, and each column represents a sample (A) Ctrl; (B) BMP2 treatment). The color scale shown at the top illustrates the relative RNA expression level; red represents high expression, and blue represents low expression.

