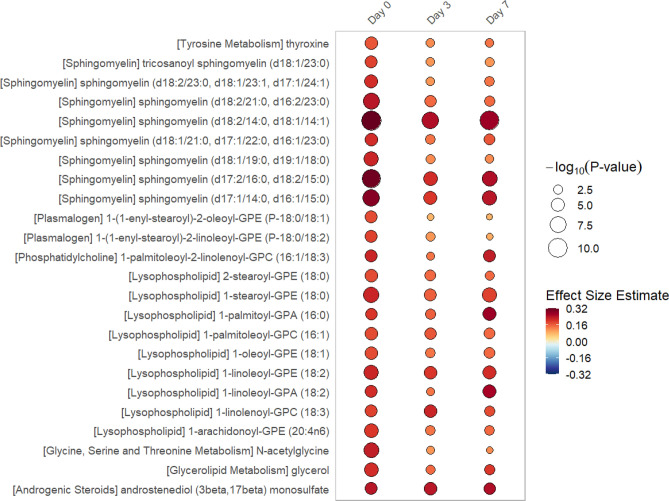
Figure 1.
Rain Plot of single time point metabolites Increased in Women. Correlations between individual metabolites and sex at day 0, 3 or 7 were determined utilizing linear regression models correcting for age, SAPS II, admission diagnosis, 25(OH)D at day 0. Day 3 and 7 estimates were also corrected for absolute change in 25(OH)D level at day 3. The magnitude of beta coefficient estimates (effect size) is shown by a color fill scale and the corresponding significance level (− log10(P-value)) is represented by size of the circle. The intensity of the red fill color represents an increase in effect size for that metabolite in women compared to men. Statistical significance is the multiple test-corrected threshold of − log10(P-value) > 4.06 which is equivalent to P-value < 8.65 × 10⁻⁵.

