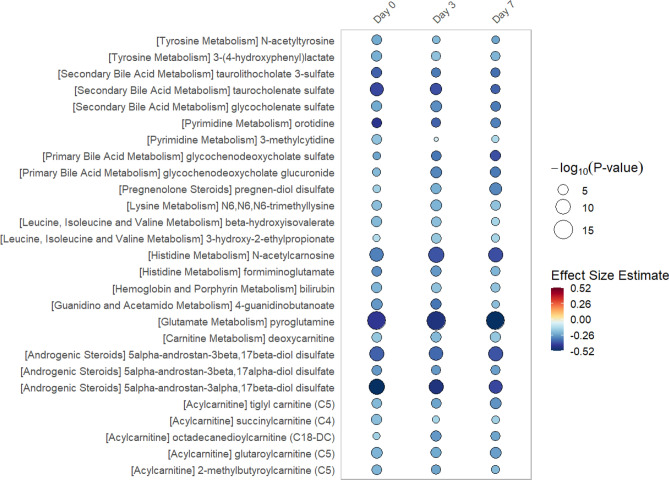
Figure 2.
Rain Plot of single time point metabolites Decreased in Women. Correlations between individual metabolites and sex at day 0, 3 or 7 were determined utilizing linear regression models correcting for age, SAPS II, admission diagnosis, 25(OH)D at day 0. Day 3 and 7 estimates were also corrected for absolute change in 25(OH)D level at day 3. The magnitude of beta coefficient estimates (effect size) is shown by a color fill scale and the corresponding significance level (− log10(P-value)) is represented by size of the circle. The blue fill color represents an decrease in effect size for that metabolite in women compared to men. Statistical significance is the multiple test-corrected threshold of − log10(P-value) > 4.06 which is equivalent to P-value < 8.65 × 10⁻⁵.

