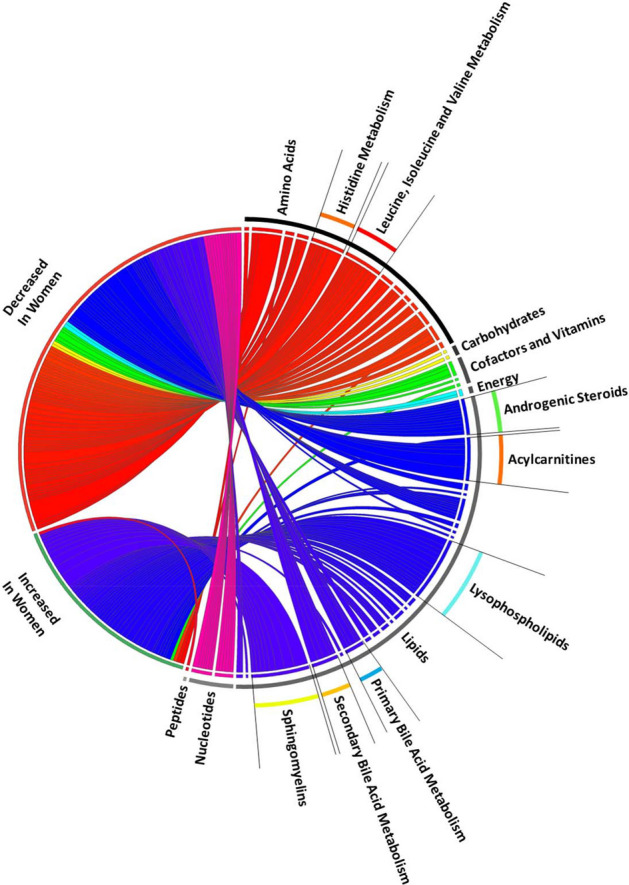
Figure 3.

Circos Plot of metabolites over multiple time points. Bipartite graph of metabolites measured in 1215 plasma samples from 428 subjects. Metabolites shown are determined by mixed-effects linear regression to be significantly increased or decreased in women relative to men over the first seven days following trial enrollment. The graph connects the increase or decrease in metabolite on the left side with individual metabolites on the right side. Width of curves indicates strength of the significance (− log10(P-value)) as determined by mixed-effects regression. Colors differ for each sub-pathway (i.e. all amino acid metabolites are red, all lipids are blue). All curves shown have P-value < 8.65 × 10⁻⁵ in mixed-effects linear regression analysis.
