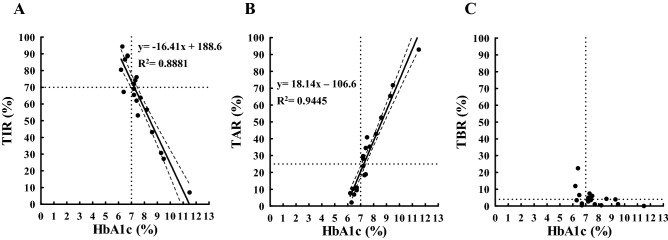
Figure 1.
Scatterplot indicating the relationship between HbA1c (x-axis) and CGM-related metrics (TIR (A), TAR (B), and TBR (C); y-axis) measured within 120 days from baseline. The solid line is the line of best-fit from the linear regression analysis. The dashed band is the 95% confidence band of the best-fit line. The dotted horizontal lines represent a TIR of 70% (A), a TAR of 25% (B), and a TBR of 4% (C): these values are based on the targets of TIR, TAR, and TBR for adults with type 1 or type 2 diabetes from recommendations of the ATTD 2019 consensus statement. The dotted vertical lines represent an HbA1c of 7%. TIR time in range (glucose 70–180 mg/dL), TAR time above range (glucose ≥ 181 mg/dL), TBR time below range (glucose ≤ 69 mg/dL), R2 coefficient of determination.

