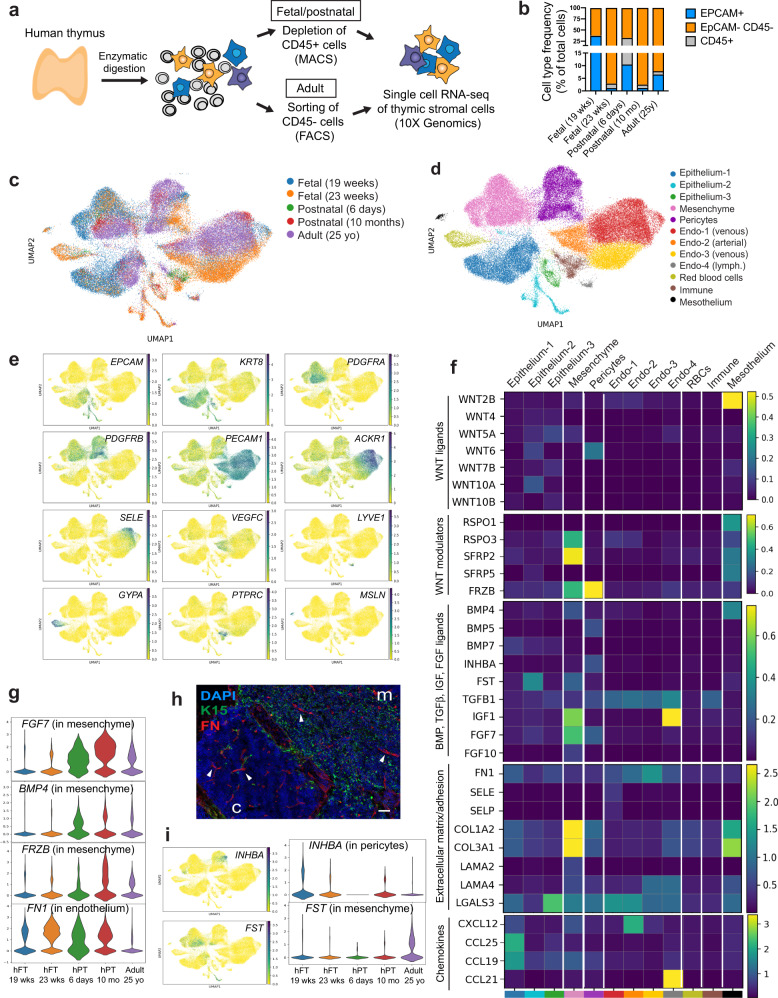
Fig. 1. Single-cell profiling of stromal cells from human thymus.
a Workflow of tissue preparation for single-cell transcriptome profiling of human thymic stromal cells. CD45-negative cells were enriched using magnetic-activated cell sorting (MACS) or fluorescence-activated cell sorting (FACS). b Stacked bar graph of cell-type frequencies in each sample. Source data are provided as a Source Data file. c UMAP visualization of thymic stromal cells colored by age group. d UMAP visualization of thymic stromal cells colored by cell types. e UMAP visualization of the expression of known marker genes used for cell cluster identification. f Heatmap showing average expression of soluble factors, extracellular matrix/adhesion molecules, and chemokines in each stromal cluster. g Violin plots showing feature gene expression in human fetal thymus (hFT), human postnatal thymus (hPT) or adult thymus. Colors represent age group. h Immunofluorescence analysis of fibronectin (FN) and K15+ immature TECs/mTECs (green) expression in human fetal thymus (hFT). Arrows point to blood vessels with high expression of FN in the cortex (c) and medulla (m). Scale bar, 50 μm. Staining was repeated twice with similar results. i UMAP and violin plots showing expression of the activin ligand (INHBA) and inhibitor (FST) in human fetal thymus (hFT), human postnatal thymus (hPT) or adult thymus. Colors represent age group.

