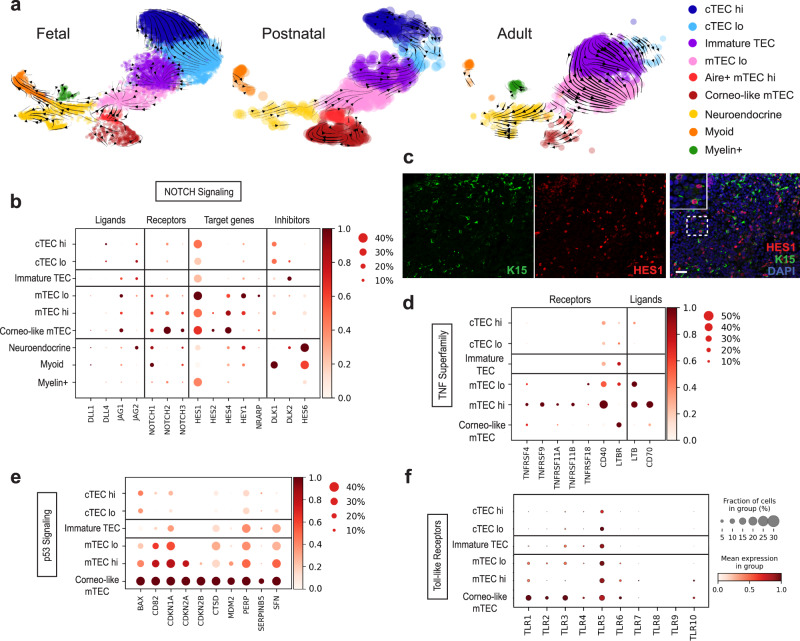
Fig. 5. Lineage decisions within the thymic epithelial compartment.
a Velocity field projected on the UMAP plots of fetal, postnatal, and adult samples. b Dot plot depicting the relative level of expression of Notch signaling ligands, receptors, target genes, and inhibitors in epithelial subsets. c Immunofluorescence staining of human fetal thymus showing expression of HES1 (red) in medullary KRT15+ TECs (green). Scale bar, 100 μm. Staining was repeated twice with similar results. d–f Dot plots depicting the relative level of expression of selected TNF Superfamily (d), p53 (e), or Toll-like receptor signaling pathway (f) genes.

