
Figure 4. Gene-wise association between maternal lifetime stress exposure and number of placental mitochondrial DNA mutations (homoplasmic + heteroplasmic).
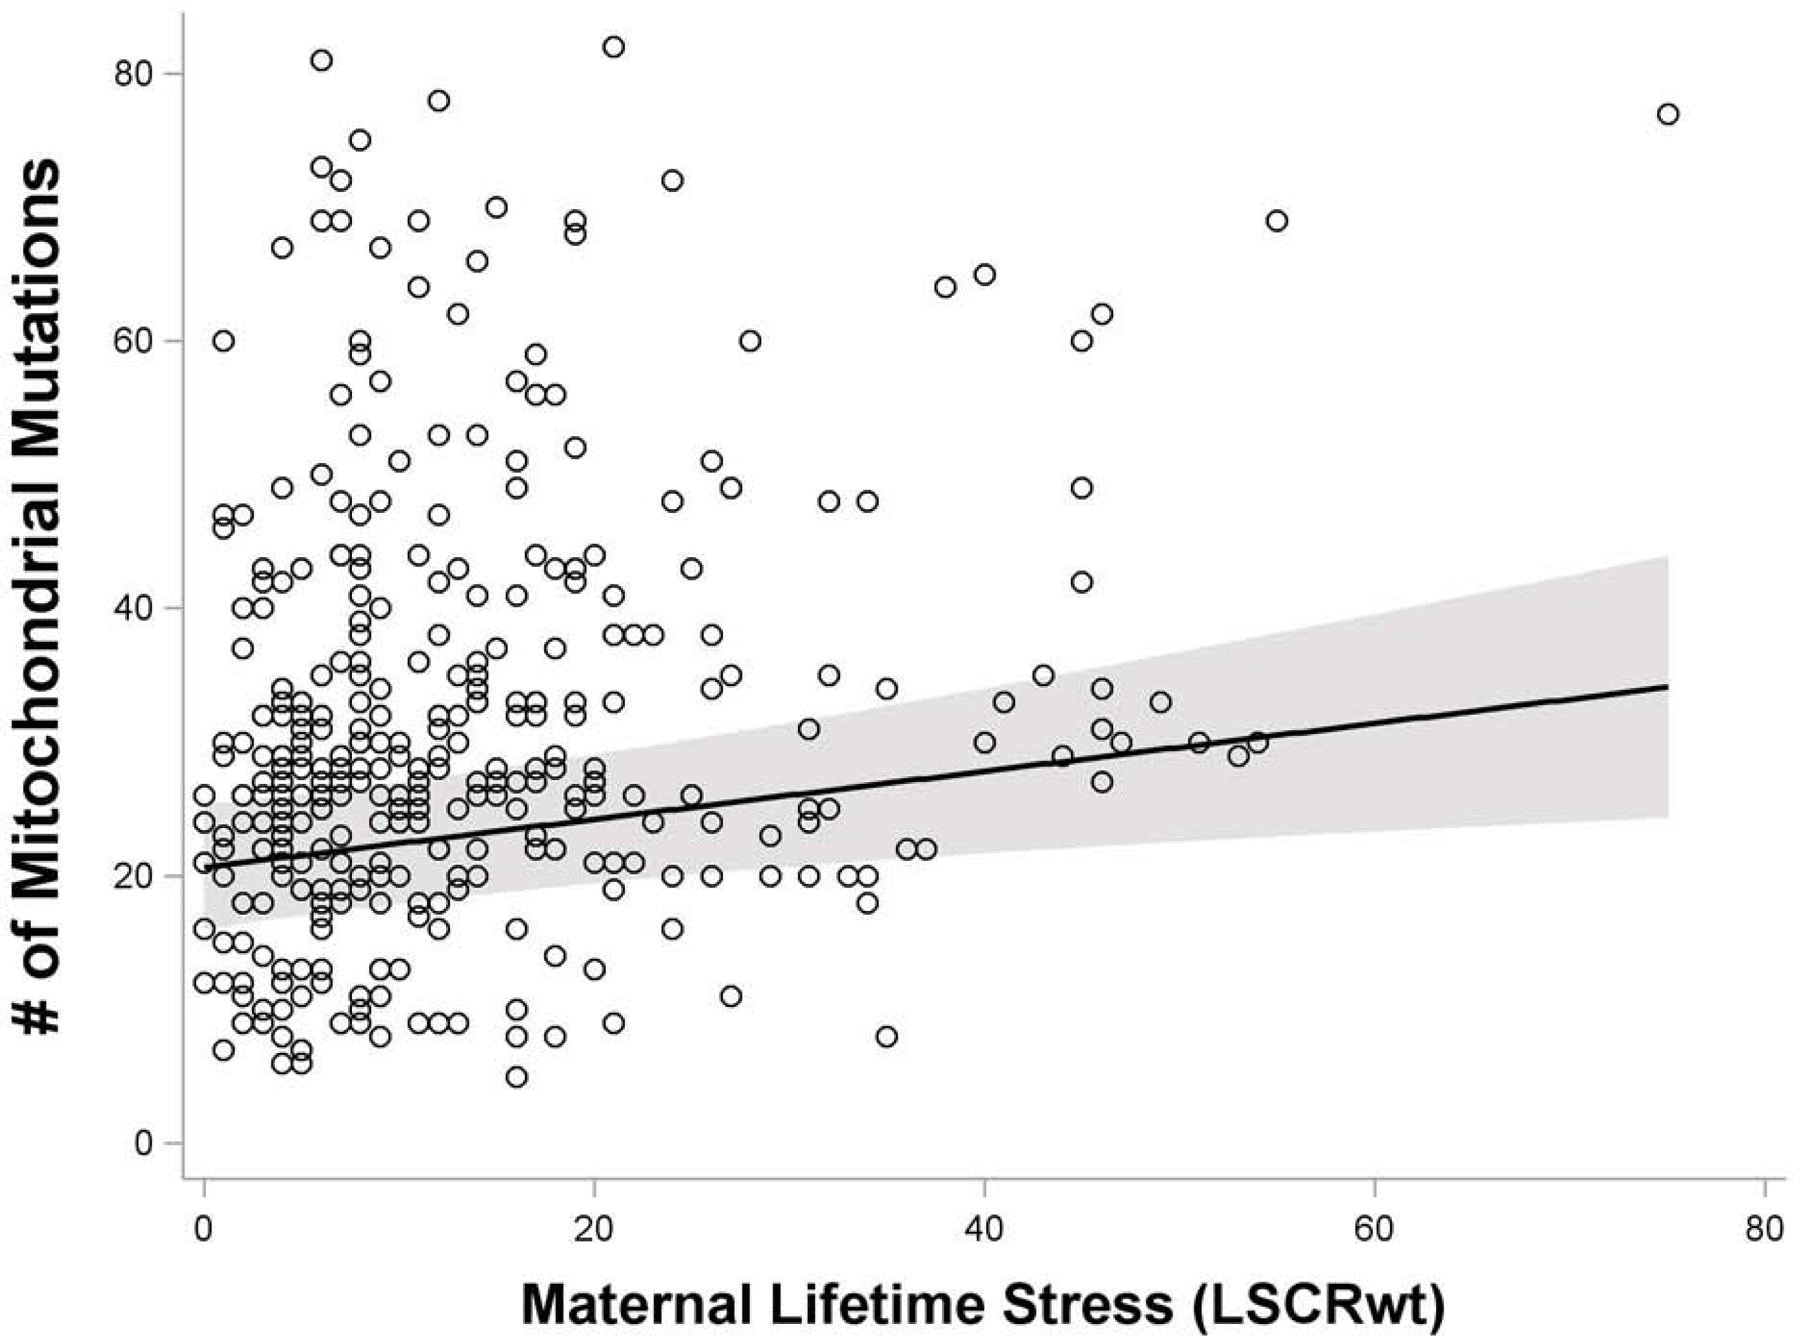
All models are adjusted for maternal age at birth, education, and race/ethnicity based on augmented backward elimination algorithm. Red dashed line represents FDR=0.05; gray dashed line p-value=0.05