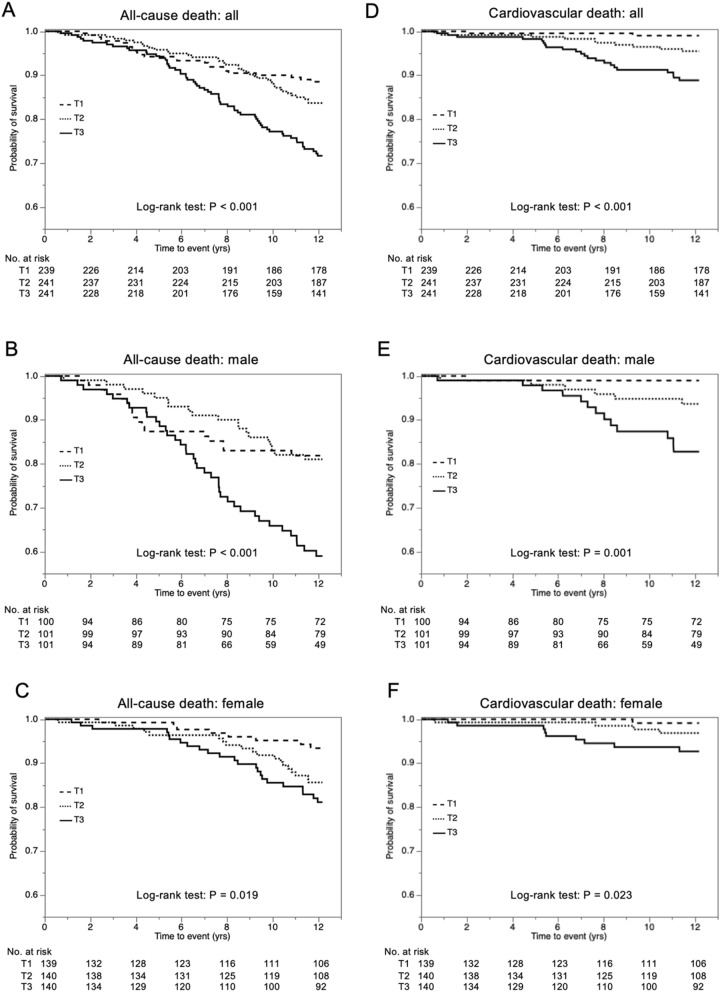
Figure 1.
Survival curves of subgroups divided by tertiles of FABP4 level at baseline. (A–C) Kaplan–Meier survival curves for all-cause death in the three groups (T1–T3) according to tertiles of fatty acid-binding protein 4 (FABP4) concentration at baseline in all of the subjects (A) and in male (B) and female (C) subjects. (D–F) Kaplan–Meier survival curves for cardiovascular death in the three groups (T1–T3) according to tertiles of FABP4 concentration at baseline in all of the subjects (D) and in male (E) and female (F) subjects. Dashed line (T1), dotted line (T2) and solid line (T3). Survival rate was compared by the log-rank test.

